I have found it works well to make price prove itself by breaking out, but then to wait patiently for the (almost) inevitable pullback to buy or sell. Article published by The Right Side of the Chart on January 25, 2013.
It is widely accepted as common knowledge in trading that new highs in securities such as stocks, bonds or commodities (or any index for that matter) is a bullish technical event. The simple logic behind it is that when a stock makes a new high, everyone holding the stock at that point is profitable and therefore, you don’t have any remorseful buyers sitting at a loss, praying for the stock to get back to their entry point so they can sell and just breakeven.
However, there are times when breakouts to new highs can actually be very bearish technical events. This is most often the case during topping phases in the markets when the institutions (smart money) are handing the bag to the retail traders or investors (often referred to as the dumb money)….no hate mail please as this is just a general term and certainly does not apply to yours truly or anyone reading this post!
What prompted me to take a look at these two charts below, the $RUT (Russell 2000 small cap index) and the IYT (Transportation sector etf) is the nearly jaw-dropping run that they have both been experiencing since the November 16th lows (I’m sure there’s a good “freight train” pun in there somewhere with the IYT). Any way, in glancing at a longer-term view of these charts, what jumped out to me was how these two recent juggernauts have a history of sparking sharp sell-offs or outright trend reversals almost immediately after breaking out to new highs. Admittedly, there’s isn’t a very large sampling of new highs (at least multi-year highs) on the $RUT but even when you zoom down to the smaller scale new highs within the larger uptrends, you can see that prices usually reverse within a few weeks of taking out the previous reaction high and where one might logically expect prices to find support on that previous reaction high as it’s retested from above, most of the corrections have far exceeded that “expected” support level.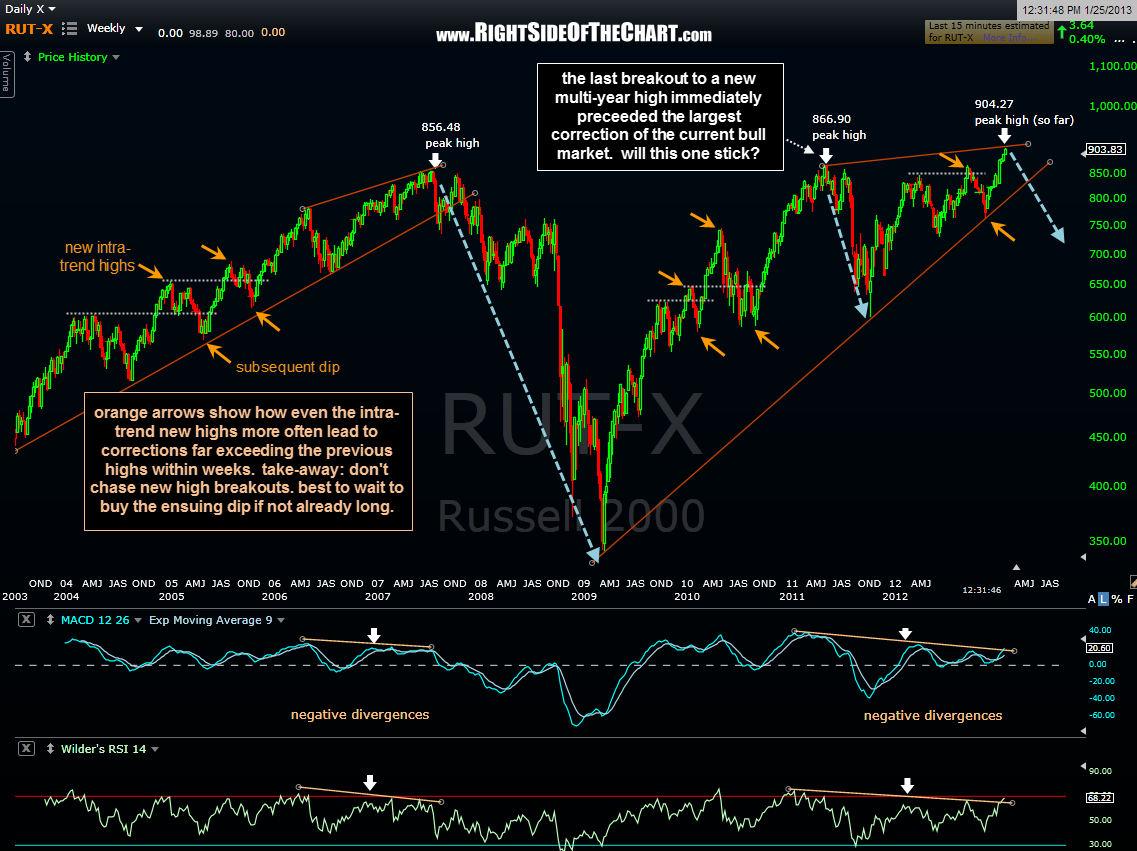
On this IYT weekly chart below, you can see a similar history of the two previous sharp sell-offs that followed the May 23rd, 2008 (week of) breakout to a new (almost) 52 week high as well as the next marginal new high made on the week of July 8, 2011 (note: IYT did actually barely eke out a slightly new high about two months earlier). Price patterns don’t repeat indefinitely and of course, even if history does repeat here once again, these are weekly charts with patterns that, just like the large divergences and wedge patterns forming on the US indices, could take weeks or even months to play out, assuming they do play out.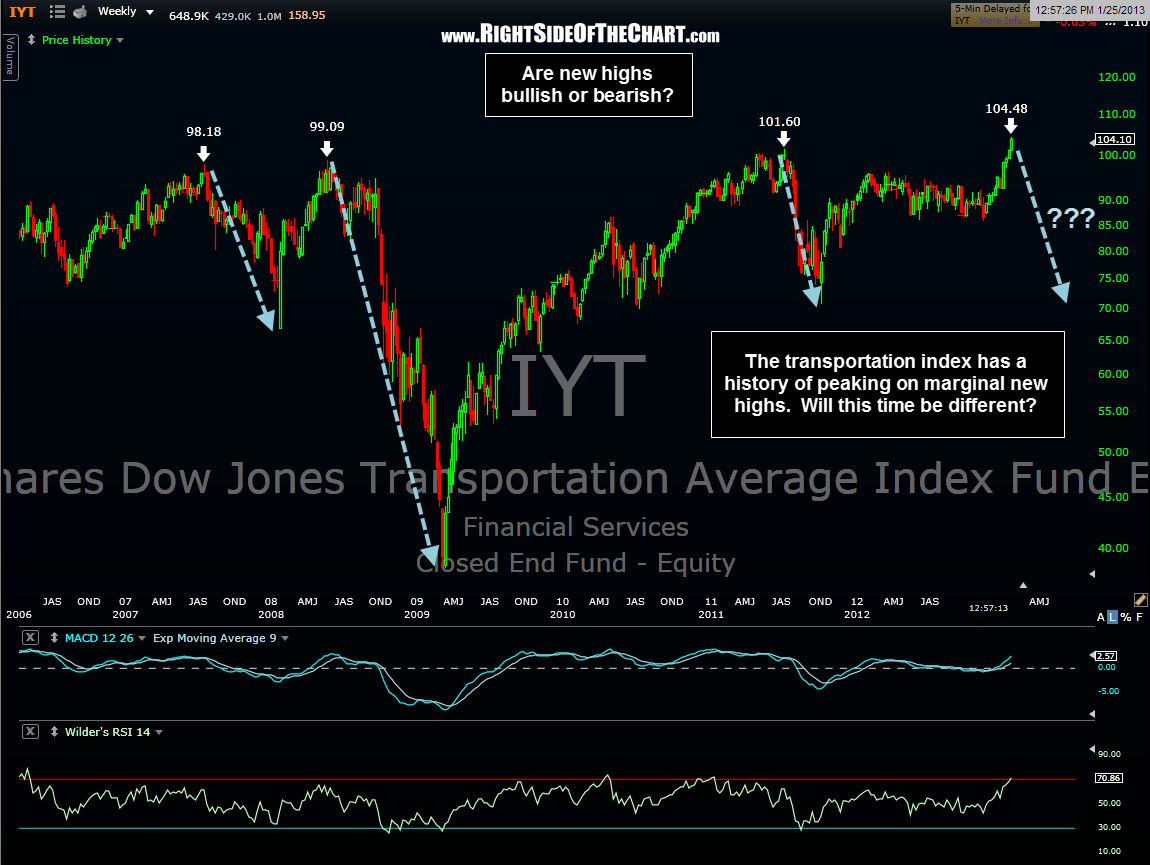
No comments:
Post a Comment