Sunday, March 31, 2013
Saturday, March 30, 2013
Friday, March 29, 2013
Don't Ignore This Chart
Arthur Hill, Don't Ignore This Chart, 3/29/2013
It has been a bearish year for Spot Copper ($COPPER) and the recent breakdown points to even lower prices ahead. In addition to MACD turning negative, copper broke triangle support to signal a continuation of the prior decline (2011). The next support zone resides in the 2.80 area.

It has been a bearish year for Spot Copper ($COPPER) and the recent breakdown points to even lower prices ahead. In addition to MACD turning negative, copper broke triangle support to signal a continuation of the prior decline (2011). The next support zone resides in the 2.80 area.
Thursday, March 28, 2013
Is This Time Different?
Joshua M Brown, The Reformed Broker, March 27th, 2013
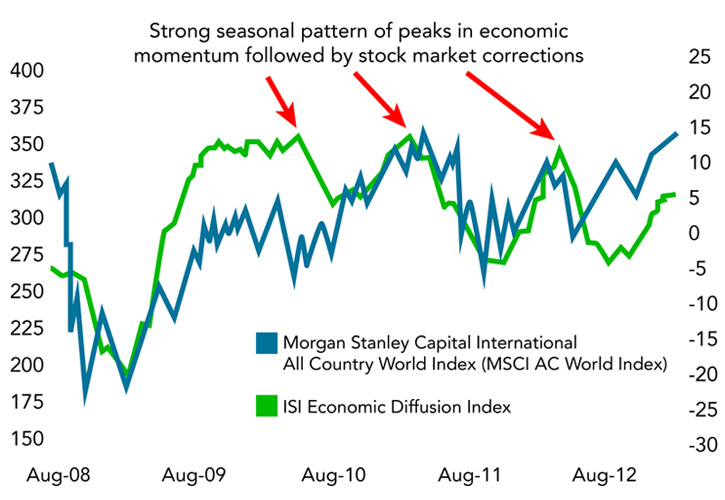
Every year so far, post-Credit Crisis, we've played the same game this time of year - economic momentum slows down, fears from Europe resume and the US stock market takes a nasty tumble.
In 2010, 2011 and 2012, the US stock market peaked during one of the four weeks of April. A correction of between 10 and 19% ensued.
The number one question on everyone's mind right now (ours included) is whether or not this spring will be yet another Risk Off Extravaganza.
Here's Jurrien Timmer, co-manager of the Fidelity Global Strategies Fund with his new chart on the topic:
- In 2010 it was the end of QE1 and the beginning of the eurozone debt crisis that led to a 17% correction in the S&P 500 from the April high to the July low (based on intraday extremes).
- In 2011 it started as an inflation shock (in terms of food and energy prices) caused by the combination of QE2 and an overheating China, which was ultimately compounded by the debt ceiling fiasco, policy tightening in China, and a further unraveling of the debt crisis in Europe. The market peaked in May and fell 21% until it bottomed in early October.
- In 2012 it was the growth recession in China combined with yet another flareup in Europe, this time brought on by the Greek elections. The S&P 500 peaked in April and fell 11% to its low in June.
Wednesday, March 27, 2013
Participation Is Waning
Mark Hanna, Market Montage, March 26, 2013. Also see A Question of Leadership.


There are a host of divergences that continue to plague the market. Yes the major indexes continue to hang in (although the Russell 2000 is lagging badly again today) but you can see below [chart 1] even in the S&P 500, participation has been weakening since latter January – as the index continues to roll upward, fewer stocks are participating as shown by the % of S&P 500 stocks over their 50 day moving average. This figure was in the 90%s range in January but dropped to mid 80%s during the prior March peak. As we go to try to touch those highs again today, the figure will be closer to the mid 70%s (it won't be updated with today's data until after the close but based on what is apparent in sector participation there won't be any huge surge). To put that in easy context when the market corrected in February, at its worst this figure was still in the low 60%s. So even as the S&P 500 is nearing highs there is only a 10% uptick in participation. Strange.
In the end I understand only price pays and that's all anyone cares about but we saw a similar situation in late winter/early spring 2012 when the market was "all about Apple" and a select group of stocks was leading the indexes up while participation weakened. Even then (March 2012) it was still in the 80% range. That took 4-6 weeks to fully play out before it collapsed on itself but we are seeing the same hallmarks for now. It can change in the future but right now it's another yellow flag.
Tuesday, March 26, 2013
Time To Short Treasuries? Maybe Not
The Fat Pitch, March 25, 2013
There are three data points you might want to consider before deciding to swing at that pitch.
Short Side of Long (with a new publication I recommend reading, here) uses COT data for small speculators to show that they are already way ahead of you. As a group, they are mega short, which has previously been the signal to look long instead.

The March BAML survey (read here) found that a net 53% of fund managers are now underweight bonds, an increase from 47% in February. This is the lowest weighting in treasuries since May 2011, which, as it turns out, also happened to be a good time to get long the bond.

Finally, there is a pronounced seasonal pattern in 10 year yields. In most years, yields start to decline in the second quarter (red arrows). Two of the exceptions came when the SPX formed a major bottom in 2003 and 2009 (blue arrows). The other two exceptions: the tech bubble in 1999, and 2005, a year in which SPX and TLT did absolutely nothing.

Monday, March 25, 2013


Sunday, March 24, 2013
Saturday, March 23, 2013
And Now For A View On Gold That Lines Up With My Views
DOLLAR TOP, COMMODITY BOTTOM APPROACHING
While I suspect this is probably the furthest thing from what most investors expect, I think the dollar index is very close to forming another major top, and once it does it should release oil, gold and the rest of the commodity index from their extended corrections. Granted no one believed me when I called the major three year cycle low in the CRB last summer either.
As you can see in the next chart, as soon as the dollar began to rally out of its last intermediate bottom, commodities, including oil and gold, all began to move down into major intermediate degree declines. For gold this has turned out to be one of the most difficult yearly cycle lows of the entire bull market, other than the eight year cycle low in 2008.

I know it doesn't seem like it but I can assure you that the gold bull market is not dead. This is just a very severe move into a yearly cycle low. Granted it is one that was exacerbated by some short-term manipulation right after QE4, but still just a normal cyclical decline that tends to occur most years in early spring. Since this particular yearly cycle low has been so severe it should act as the spring board for the next major leg up in the secular gold bull market.

As we have seen in the gold market, a move down into a yearly cycle low tends to be the most severe cyclical decline. Now it is the dollars turn to move down into a yearly cycle low. Over the next 2-3 months we should see the dollar retest, and then break through the 79 support zone. When it does I expect to see a waterfall decline similar to what has transpired in the Japanese Yen and the British pound recently.
This should drive the next leg up in the CRB's rally out of its three year cycle low, and trigger the first real inflationary surge, which I think will culminate in a massive spike in commodity prices sometime in late 2014 or early 2015.

I also think the expected hard move down in the dollar will trigger a violent rally in the precious metals market.
Conversely as the move down into a yearly cycle low tends to be the most severe, the rally out of a yearly cycle low is often the most aggressive.
Considering the extreme oversold technical, and sentiment levels in the precious metals market, we now have the conditions necessary to power a violent rally, at least to test the 2011 highs over the next 2-3 months. Once that test is complete we should see gold break out to new highs on its way to an expected final T1 PATTERN C-wave top somewhere in the neighborhood of $3200.

Since currency cycles often turn on the monthly employment report, I think there's a good chance that the dollar index is going to put in its intermediate top either Thursday or Friday. I think the odds are about 50/50 that gold has already completed its yearly cycle low slightly ahead of the dollar on February 20, and oil & the CRB may have formed final intermediate bottoms on Tuesday. If not then they may wait for a final top in the dollar, although usually commodities will sniff out a currency turn a few days early, and gold often by a week or so.
Based on the COT reports, commercial traders are already positioned for the next leg up in gold, and institutional money has been entering the precious metals market in a big way as evidenced by the buying on weakness numbers in GLD on February 28.
It shouldn't be long now before all of the traders that have given up on the precious metals sector get reminded that this is still a secular bull market. And secular bull markets continue to rise until the fundamentals reverse.
In the 70s and 80s gold rallied until Volcker reversed monetary policy 180° and raised interest rates to 20%. Bernanke is still stuck in Keynesian monetary theory and is showing no signs of reversing policy any time soon. Until Fed policy changes the gold bull market will remain intact.
http://www.smartmoneytracker.blogspot.com/
Another View On Gold...Not My View...But Good To Look At Others Opinion
Time To Buy Gold?
Kevin's Market Blog, March 21, 2013. The stage is certainly set for a short-term rally in gold, but the long-term trend is down. So far, upward price movement has been too weak to convince me that is going to change. Long-term trends in gold can be very persistent. I'd say there is a good chance that the support at 1500 will crumble and the price of gold will continue to fall.


Above is a daily chart of gold (GLD) over the past 20 months and as you can see this market appears to be bouncing off of major support (green line). In the lower panel is the Gold/S&P ratio which has just broken its 4 month down trendline suggesting that money is now moving into gold and out of stocks.
You'll notice red vertical lines on the chart which are exactly the same distance apart. As you can see there seems to be a major change of sentiment that takes place in gold every 4 1/2 months. The reason I consider this significant is because gold appears to be reacting to this time cycle once again making a turning point precisely on schedule.

The next chart is a 4 year weekly chart of gold futures with the net position of the commercials which is the red line in the lower panel. The commercials are holding their largest long position in years which in my opinion is bullish. The last time the commercials held such a net long position was back in June of last year which triggered a nice 3 month rally. I think we are going to see a similar rally so this is definetly a market to keep an eye on. As always, lets see what happens!
Friday, March 22, 2013
Thursday, March 21, 2013
Notes From Jim Sinclair Symposium

There were basically 1000 people in a huge conference hall at the Hilton
Hotel –Jim took and answered questions the entire time.. I got there
15 mins early (1.45) & the place was packed already & it was obvious
he had already been going for at least a half hour – I left @ 5.30,
and he was trying to squeeze in a few more questions before they
kicked us out.. So basically he went on for 4 straight hours…
I have to say, this man is extremely impressive – The knowledge &
experience he has attained over such a long period (he was a market
maker when he was 19yrs old) – he’s seen it all, and experienced it
all, and he is able to articulate his knowledge to such a wide &
diverse array of people. Mostly I took away that he generally cares
about people – he wants to give back, and he wants to see the little
guy make it..
Anyway, I took notes which aren’y organized, but are all over the
place due to the town hall format.. This will be a long email, so
apologies, but I figured some people out there would like some cliff
notes, so here they are:
1 – When asked about keeping gold outside the US – he answered almost
all his Gold is outside of the US – its in Africa..
2 – Markets revalue ccys on a daily basis & this will continue for the
dollar. In his view there will not be a official devaluation, they’ll
just continue to cheapen quietly as they have over the past decade..
3 – He definitely follows some sort of cycles, and certain numbers are
significant (this is out of my wheelhouse but I took note anyway) He
believes Gold to 3100-3300 is a minimum & will occur between
2015-2017.. He believes the ccy crisis/end game will all play out by
2020-2021.. At that point gold will have settled in @ 4500 or so &
we’ll have to move on w/ our life..
4 – He doesn’t love the CAD, but if you must hold ccy exposure in your
portfolio he’d prefer a resource ccy like the loonie..
5 – He doesn’t believe that Silver has monetary characteristics, and
therefore wont maintain its price rise, although gold will. .He
doesn’t believe is Silver monetization
6 – Current financial system is like Sodom & Gamorrah (but less fun) –
However, don’t extrapolate into perpetuity – Things change/cycles
change/ and things will be different in the future –
7 – Ponzi schemes can work! – If they are accepted by the public..
8 – Silver could hit 100 in a speculative frenzy, but he doesn’t
believe it would stay there.
9 – You wont be able to break the Dow due to the enormous
liquidity..Buy pullbacks, it will be going higher… Its overbot & could
have a sharp pullback short term, but its a buy.
10 – For the youth – if you want a job in the future, become a
geologist, a good one..
11 – He doesn’t buy these FDIC insured Gold CDs.. Like any other
insurance, you have counterparty risk.. Buy the physical
12 – Doesn’t like the Perth Mint – Cost of moving from unallocated to
allocated is way too high
13 – Gold Co’s in the 1950s were yielding 15-20% – they were
utilities.. He believes they should be/will be again..
14 – He’s bullish gold stx – hugely undervalued, beaten down – Buy
whats cheap, not whats dear..
15 – Central planners actually believe they can pull this off & land
this plane.. They believe the economy will recover to bail us out, &
they’ll simply let the securities they’ve bot mature… Bernanke is a
academic, so he doesn’t understand how the real world works.. He
believes he’s right w/ all of this QE..
16 – Bernanke did save our a$$ after Lehamn.. If he didn’t act as he
did, we’d all be living in a cave as it would have been a absolute
catastrophy.. The error has been to continue it this long
17 – No exit to QE – No end in sight because there is not a true recovery..
18 – Bonds wont fall, yields wont rise because Ben can buy them
unlimited & he will..
19 – Someone asked why Sprott doesn’t go to the Comex for his 2b in
Silver & break the manipulation – Sinclair said he wont do it, because
“he’s a gentleman” He wont “break the playing board” – there is a
ethical code amongst these giant players.. He wont break an exchange,
because the entire system would then be against you.. Nobody will do
this.. They/We wont get this, we wont get instant satisfaction like
that.
20 – End of this crisis will come in 2021 – Move on to something else
like education or real estate.. Become a doctor or lawyer, or plumber
– develop a trade..
21 – I don’t understand this, but what are these Golden Angels +
numbers you see on his blog? There is significance in them & he leaves
clues, but I just don’t get it.. (can anyone shed light here?)
22 – If you want to get rid of criminals (banksters) you reduce their
profit margin – They’ll then go do something else.. I found this
interesting, because this is exactly what I’ve told you the regulators
are doing today..
23 – Retirement Accts – Stop contributing, pay the tax, & cash them
out… If you are at a firm that is matching contribution its different
because the company has 50% of the risk
24 – He’s not negative on the future, he’s optomistic for better
days.. You can’t stop living your life due to whats going on in the
world
25 – The EUR will outperform the dollar – They have already started
austerity while we haven’t – They have gold & mark it to mkt..
26 – There is no inflation because there is no velocity of money..
History has shown that velocity picks up when confidence is lost –
this is what you have to look for
27 – China is a Maoist nation, except they now want wealth
28 – BRICS are where the opportunity is – they are taking over & their
culture is very different to ours (they execute bankers, what do we
do?)
29 – Cycles & Cycle analysis wont take you to prosperity.. They aren’t
a road map, but he likes them for picking up divergences (i.e. this
cycle should be bottoming, but isn’t – this is a clue, telling us
something) Gov’t interference has rendered them useless..
30 – Alf fields is a legitimate human being who works hard at his
craft – he respects him & believes his Gold target will be met,
although he disagrees with why that would happen…
31 – Once we close above 1620, we’ll be on our way to 3500.. The lows
will be cemented
32 – There will be a transition from paper to physical, but I don’t
think its how most people interpret this.. He’s not saying the comex
will break or go away, he’s saying that the ability of the Comex paper
traders (who are arbitraging & spreading) to manage price will cease..
We have already been seeing this as paper traders will attacking gold
all day @ 1611, but the physical buyers were stepping up @ 1606.. I
found this interesting because AM also quoted 1606 as a key physical
pivot, so its obvious these men have contacts who buy physical in size
& they know where they are bidding..
32 – Only gold can increase the sovereign assets vs liabilities..
Ratio of a ccy’s gold to M3 will be the measure
33 – Fiat & fractional reserve banking will continue to exist in the
new world, but the ccy will take its cue from M3 based on physical
34 – By flushing Lehman, they ruined their chances/ability to net down
all of the derivs.. They could have done a S&L & put them all in a
“bad bank” to net them down/wnd them down – but we blew that
opportunity
35 – views the London fix as meaningless – its like libor
36 – Gold at minimum to 3100-3300, by 2015-2017, then up to 4400 – You
should then be selling!
37 – On miners – they should use their gold to fund their operations;
don’t dilute shareholders.. He vowed to never issue another share in
his company – The float wont go above 100mm (place erupted in
applause)
38 – 1764 was ruthlessly attacked by the sghorts & is now major
resistance.. Funds were duped into thinking bail-ins would replace
bail-outs – this has now been proven wrong by the Cyprus rejection
39 – Learn to sell your gold – Don’t “hold it for your kids” Rather,
when the chart is a rhino, sell a third, when its a fishing line, buy
it back.. If it runs away before you get your third back, laugh all
the way to the bank
40 – China doesn’t want to be a world reserve ccy – they don’t want
that responsibility/burden. Rather they want to be the ccy of choice,
not by decree.. they’ll do this by amassing 15% of reserves in gold ..
everyone will then want Yuan
41 – US devalue wont be overnight – daily mtm
42 – If/once they can’t QE, they’ll come for the retirement accts –
You have 2 years to figure it out…
43 – Wonderland mentality w/ QE is skewing cycles and any measurements
of activity -they’ve created a false economic world..
44 – Gold is alien to institutions & fund managers – Not how they’ve
made their money, not what they’ve been taught in school or at work
45 – Mgmt of Gold Stx are the worst out there
46 – His goal is to get us out of gold at the top – Only then will his
job be done..
47 – China lies about their gold reserves – These people plan for
centurys, America can’t even plan for tomm
48 – Future of the BRICs is brighter than that of the US – They aren’t
strangulated by debt…
49 – Saudia Arabia is no longer prominent – They bot everyone off, but
now they are running out of money to do so.. They contribute to the
red cross + to al quaeda
50 – Petro dollar is trending towards less use..
51 – Physical is starting to win – Haven’t been able to push gold
below 1600, but they have certainly been trying… Each day we hold here
is a positive
52 – When he called the gold top in 1980 he received many death
threats, credible ones.. Not the “I’ll kill you man”
53 – Someone commented how did he know we’d be @1600 by his birthday,
almost like he has insider knowledge, similar to some of his other
calls.. He commented he’s been in this business for 50 yrs & people
come to him for advice & they offer info to him as well in return..
He’s got a leg up on all of us from that standpoint..
54 – Comex traders will start getting nervous when they realize they
can’t take us lower.. They’ll cover (remember from before, these guys
are arbitrage & spread players)
55 – In regards to interest rates – Someone asked about variable vs
fixed.. He said once DXY goes below 72, get out of all variable
instruments & go to fixed(home equity/mortgage) .. I personally found
this a particularly usefull tidbit of info..
56 – If hyperinflation came, it would be extremely nasty but would
only last for about 90 days.. They’d then reset the system
57- The American Dream belonged to his generation… its now been
screwed up for the rest of us.. We can’t undo whats been done, no
going back.. He wished we could have grown up in the 50s – Life was so
much easier then.. He’s happy he is his age, but fears for his kids
58 – Have your kids learn Mandarin – It will be a usefull skill
Bombay Sapphire Losing It's Luster?
March 21, 2013, The Canadian Technician, written by Greg Schnell

The $BSE (Bombay Stock Exchange in India) has formed a perfect H/S top. The momentum is declining as I have labelled the H/S top on the price and MACD. Notice the low level of the MACD failing to jump back above zero.
The other day I posted a red/green chart of the stock indexes above the 20 Month Moving Average.
I noted that 3 of the 4 BRIC countries had fallen below the 20 Month MA level. Shanghai (China), Russia and Brazil.
Well Shanghai got a big bounce yesterday which is great news so it is back above the 20 MMA.. What I noticed cruising through the charts after the close Wednesday, was this ominous pattern.
The $BSE (Bombay Stock Exchange in India) has formed a perfect H/S top. The momentum is declining as I have labelled the H/S top on the price and MACD. Notice the low level of the MACD failing to jump back above zero.
If all the BRIC countries are struggling, that is a big concern. Maybe Bombay rallies from here. They can but this pattern is a very important pattern that usually identifies major tops. I also noted that Taiwan and Singapore are starting to soften on the ETF's.
I did notice something while going through my GSCI charts (Goldman Sachs Commodity Index Charts). All of them looked like they were at a pivotal point. An outright fail here and now or a great place to start a new rally? That 'Moment' is upon us. The $BSE chart leads me to believe the former, but I desperately want to see the latter.
The Rest of the World dragged down the US market in 2011. I'm watching for a global commodities rally. If I don't get it, I'm watching for a softening of the equities markets in a large move down through the summer. $COPPER would suggest the move is to the downside. US housing starts and Transports would suggest the move is to the upside.
If the BRIC's continue tumbling, I would suggest our portfolios will as well.
Global Pyramid Scheme By The Numbers

Why is the global economy in so much trouble? How can so many people be so absolutely certain that the world financial system is going to crash? Well, the truth is that when you take a look at the cold, hard numbers it is not difficult to see why the global financial pyramid scheme is destined to fail. In the United States today, there is approximately 56 trillion dollars of total debt in our financial system, but there is only about 9 trillion dollars in our bank accounts.
So you could take every single penny out of the banks, multiply it by six, and you still would not have enough money to pay off all of our debts. Overall, there is about 190 trillion dollars of total debt on the planet. But global GDP is only about 70 trillion dollars. And the total notional value of all derivatives around the globe is somewhere between 600 trillion and 1500 trillion dollars. So we have a gigantic problem on our hands.
The global financial system is a very shaky house of cards that has been constructed on a foundation of debt, leverage and incredibly risky derivatives. We are living in the greatest financial bubble in world history, and it isn't going to take much to topple the entire thing. And when it falls, it is going to be the largest financial disaster in the history of the planet.
The global financial system is more interconnected today than ever before, and a crisis at one major bank or in one area of the world can spread at lightning speed. As I wrote about yesterday, the entire European banking system is leveraged 26 to 1 at this point. A decline in asset values of just 4 percent would totally wipe out the equity of many of those banks, and once a financial panic begins we could potentially see major financial institutions start to go down like dominoes.
We got a small taste of what that is like back in 2008, and it is inevitable that it will happen again.
The following is the global financial pyramid scheme by the numbers...
-$9,283,000,000,000 - The total amount of all bank deposits in the United States. The FDIC has just25 billion dollars in the deposit insurance fund that is supposed to "guarantee" those deposits. In other words, the ratio of total bank deposits to insurance fund money is more than 371 to 1.
-$10,012,800,000,000 - The total amount of mortgage debt in the United States. As you can see, you could take every penny out of every bank account in America and it still would not cover it.
-$10,409,500,000,000 - The M2 money supply in the United States. This is probably the most commonly used measure of the total amount of money in the U.S. economy.
-$15,094,000,000,000 - U.S. GDP. It is a measure of all economic activity in the United States for a single year.
-$16,749,269,587,407.53 - The size of the U.S. national debt. It has grown by more than 10 trillion dollars over the past ten years.
-$32,000,000,000,000 - The total amount of money that the global elite have stashed in offshore banks (that we know about).
-$50,230,844,000,000 - The total amount of government debt in the world.
-$56,280,790,000,000 - The total amount of debt (government, corporate, consumer, etc.) in the U.S. financial system.
-$61,000,000,000,000 - The combined total assets of the 50 largest banks in the world.
-$70,000,000,000,000 - The approximate size of total world GDP.
-$190,000,000,000,000 - The approximate size of the total amount of debt in the entire world. It has nearly doubled in size over the past decade.
-$212,525,587,000,000 - According to the U.S. government, this is the notional value of the derivatives that are being held by the top 25 banks in the United States. But those banks only have total assets of about 8.9 trillion dollars combined. In other words, the exposure of our largest banks to derivatives outweighs their total assets by a ratio of about 24 to 1.
-$600,000,000,000,000 to $1,500,000,000,000,000 - The estimates of the total notional value of all global derivatives generally fall within this range. At the high end of the range, the ratio of derivatives to global GDP is more than 21 to 1.
Are you starting to get the picture?
Every single day, the total amount of debt will continue to grow faster than the total amount of money until the day that this bubble bursts.
What we witnessed back in 2008 was just a little "hiccup" in the system. It caused the worst economic downturn since the Great Depression, but global financial authorities were able to get things stabilized.
Next time it won't be so easy.
The next wave of the economic collapse is quickly approaching. A full-blown economic depression has already started in southern Europe. Unemployment is at record highs and economic activity is contracting rapidly.
The major offshore banking centers in Cyprus are on the verge of collapsing. It was just announced that they will now be closed until Tuesday, but nobody really knows for sure when they will be allowed to reopen. And there is already talk that when they do reopen that there will be strict limits on how much money people can take out.
And now the IMF is warning that the three biggest banks in Slovenia are failing and that a billion euros will be needed to bail them out.
The dominoes are starting to tumble, and the United States won't be immune. In fact, the greatest financial problems that the United States has ever seen are on the horizon.
But you can just have faith that Ben Bernanke, Barack Obama and the U.S. Congress know exactly what they are doing and will be able to save us from the coming financial collapse if you want.
http://www.activistpost.com/2013/03/why-is-world-economy-doomed-global.html
Wednesday, March 20, 2013

A Bear Nugget
A quite compelling chart from Ryan Detrick of Schaeffer's Investment Research – here is the recent history of the S&P 500 when the investors intelligence survey shows a bear reading of 20% or less, as we currently sit. It doesn't bode well for the market save for one instance in late fall 2009 (during QE1) when it stayed at that level for a while without a sizable correction . We'll see if this is yet another historic measure that simply "does not matter" in a QEforever environment. Ironically this is the fourth year in a row it has hit that level in April.

http://www.marketmontage.com/2013/03/20/what-happens-when-the-bears-in-the-investor-intelligence-survey-break-below-20/
Interesting Time For Gold
March 19, 2013, The Canadian Technician, written by Greg Schnell


You can see that the bullish percent level is at 5 year lows. Eventually this turns. You can choose to use the Bullish Percent, The GDX or the Price of Gold which has already started to move higher. I am more interested when the stocks confirm the move. The $BPGDM updates at the end of the day (EOD) which is indicated on the top frame of the chart beside the ticker. So you would enter on the following day if this could turn up.
Lets look at 3 charts:
Here is Gold. We will use GLD as I can get 60 minute data to compare to the GDX 60 minute chart below. Notice how it has broken above 11 day highs. Back in January February it was not able to break out above the $163.04. GLD has broken through the first level of resistance and a break above the $156.80 level would indicate a much more important break.
Here is GDX which is an ETF that tracks a group of Gold Miners.
Look at the differences between the Late January - early February period and compare that to now. Both periods are about 3 weeks. Notice the rising lows currently. There is a much larger interest level showing up on this chart. Look at the volume now compared to then. Note that this is a 60 minute chart, so this is huge volume every hour. The RSI has made higher highs than previously, but has not broken out. In my methodology, I would like to buy if it can break through the ceiling of $38.20. I don't want to own it if it can not. Secondly, my stop will be just under the red line if I am wrong.
Here is the $BPGDM
You can see that the bullish percent level is at 5 year lows. Eventually this turns. You can choose to use the Bullish Percent, The GDX or the Price of Gold which has already started to move higher. I am more interested when the stocks confirm the move. The $BPGDM updates at the end of the day (EOD) which is indicated on the top frame of the chart beside the ticker. So you would enter on the following day if this could turn up.
The bottom chart has all 3 together except we can use the $GOLD chart as the data is for daily.
If your interested in trading $GOLD, now is a very interesting time.
Tuesday, March 19, 2013
Monday, March 18, 2013

Three C's Spell Disaster
Chris Kimble, dshort Advisor Perspectives March 18, 2013. I don't always agree with Kimble's analysis, but I think he's right this time - if copper and crude oil break down simultaneously, it will be a symptom of serious economic weakness, and bad news for the stock market.
In the sporting world the popular news story of the weekend was the March Madness brackets. In the business world the news story of the weekend came from the small island of Cyprus. Should we be concerned about the Cyprus story or is it simple Madness to be concerned about this small island and its impact on global growth?
In the sporting world the popular news story of the weekend was the March Madness brackets. In the business world the news story of the weekend came from the small island of Cyprus. Should we be concerned about the Cyprus story or is it simple Madness to be concerned about this small island and its impact on global growth?
The action of the banks in Cyprus may not be good for depositors, nor do I feel this is sending a good message.
When it comes to the Power of the Pattern and price messages that matter, the message from Copper and Crude Oil in the near future I believe is the real story to pay attention to! The weakness in Copper of late has it breaking some support lines, and Crude Oil has formed a multi-year flag pattern that should end soon.

Should Copper and Crude break down further, they would be sending a message that the global economy is slowing down, and we should bear in mind that the correlation between the S&P 500 and Copper/Crude is an important one!
Pay attention to Cyprus? Sure. But the bigger story is the price action in Copper and Crude Oil over the next few weeks and what they could be telling us about the global economy.
Will The Cyprus Event Spark A Move In The Miners?
Cam Hui, Humble Student of the Markets, March 18, 2013
The blogosphere is full of comments about the Cypriot bailout on the weekend (for examples, see How to start a banking crisis, Cyprus edition and The Cyprus conspiracy II). Instead of writing about Cyprus, a topic that I have no special expertise in, I thought that it would be timely to write an update to my blog post on February 19 about the resource-based sectors (see Time to buy gold and commodity stocks?).
Since I wrote that post, the metals and mining stocks have begun to stage a turnaround. To recap, the mining group is showing signs of being overly beaten up and washed out. This chart of XME, the mining ETF, against the market shows that it is trading at or near investor capitulation levels relative to its long-term history.

Take a look at the shorter term one-year relative chart of XME vs. SPY. The miners are starting to show some positive relative strength against SPY. Is that the sign of a nascent recovery?

Similarly, gold stocks are highly unloved against bullion. I have not been a big fan of buying gold stocks for gold bulls (see Where is the leverage to gold?), but in this case a long gold stock/short bullion position is likely to have much better risk/return profile than any time in the recent past.

Shorter term, however, my inner trader is still watching this pair of a relative turnaround as the HUI/Gold pair remains in a relative downtrend.

On the other hand, I can't say I am overly bullish on gold itself. The silver/gold ratio, which is a measure of the speculative interest in precious metals, is stuck in the middle of its historical band indicating neither excessive bullishness nor excessive bearishness on the PM complex.

Nevertheless, I am seeing signs of a capitulation, or washout, in investor sentiment. Here in Canada, the chart of the junior Venture Exchange Index against the more senior TSX Index shows that the ratio is at or near levels indicating investor capitulation in the juniors, which are mostly junior resource companies.

Not enough energy in Energy?
In my last post on this topic, I was more constructive on the energy sector as the sector was showing signs of a relative strength turnaround. Since then, the sector remains range-bound against the market and appears to be consolidating sideways on a relative basis.

The price of Brent crude confirms my observation about the range bound, or sideways consolidation pattern shown by energy stocks.

At this point in time, the energy sector may not have enough energy, or momentum, to present itself as the new emerging leadership sector.
As I write these word, the markets have a risk-off reaction over the Cyprus news. EUR is plummeting against all currencies and against JPY in particular; USD is up: ES is falling and gold is up marginally but a base metal like copper is down. While the initial market reaction isn't necessary the sustainable reaction, the Cypriot event may serve as a catalyst for the resource sectors (and the metals in particular) to stage a turnaround and present themselves as the new market leadership. It will also prove to be an important market test for the price of gold (and the gold bugs), to see whether investors flock to USD assets or to gold in this instance of an unexpected eurozoneconfiscation tax of banking depositor assets.
The blogosphere is full of comments about the Cypriot bailout on the weekend (for examples, see How to start a banking crisis, Cyprus edition and The Cyprus conspiracy II). Instead of writing about Cyprus, a topic that I have no special expertise in, I thought that it would be timely to write an update to my blog post on February 19 about the resource-based sectors (see Time to buy gold and commodity stocks?).
Since I wrote that post, the metals and mining stocks have begun to stage a turnaround. To recap, the mining group is showing signs of being overly beaten up and washed out. This chart of XME, the mining ETF, against the market shows that it is trading at or near investor capitulation levels relative to its long-term history.

Take a look at the shorter term one-year relative chart of XME vs. SPY. The miners are starting to show some positive relative strength against SPY. Is that the sign of a nascent recovery?

Similarly, gold stocks are highly unloved against bullion. I have not been a big fan of buying gold stocks for gold bulls (see Where is the leverage to gold?), but in this case a long gold stock/short bullion position is likely to have much better risk/return profile than any time in the recent past.

Shorter term, however, my inner trader is still watching this pair of a relative turnaround as the HUI/Gold pair remains in a relative downtrend.

On the other hand, I can't say I am overly bullish on gold itself. The silver/gold ratio, which is a measure of the speculative interest in precious metals, is stuck in the middle of its historical band indicating neither excessive bullishness nor excessive bearishness on the PM complex.

Nevertheless, I am seeing signs of a capitulation, or washout, in investor sentiment. Here in Canada, the chart of the junior Venture Exchange Index against the more senior TSX Index shows that the ratio is at or near levels indicating investor capitulation in the juniors, which are mostly junior resource companies.

Not enough energy in Energy?
In my last post on this topic, I was more constructive on the energy sector as the sector was showing signs of a relative strength turnaround. Since then, the sector remains range-bound against the market and appears to be consolidating sideways on a relative basis.

The price of Brent crude confirms my observation about the range bound, or sideways consolidation pattern shown by energy stocks.

At this point in time, the energy sector may not have enough energy, or momentum, to present itself as the new emerging leadership sector.
As I write these word, the markets have a risk-off reaction over the Cyprus news. EUR is plummeting against all currencies and against JPY in particular; USD is up: ES is falling and gold is up marginally but a base metal like copper is down. While the initial market reaction isn't necessary the sustainable reaction, the Cypriot event may serve as a catalyst for the resource sectors (and the metals in particular) to stage a turnaround and present themselves as the new market leadership. It will also prove to be an important market test for the price of gold (and the gold bugs), to see whether investors flock to USD assets or to gold in this instance of an unexpected eurozone
Subscribe to:
Posts (Atom)