Total Pageviews

Tuesday, August 30, 2011

Market Humorist Vol 2

Good Bye Common Cold!


. .  a team of researchers at MIT's Lincoln Laboratory may have found the cure for the common cold as well as many other viruses like H1N1 influenza, stomach viruses, a polio virus, several types of hemorrhagic fever and dengue fever. The team, led by Todd Rider, a senior staff scientist in Lincoln Laboratory's Chemical, Biological and Nanoscale Technologies Group, created therapeutic agents called Double-stranded RNA Activated Caspase Oligomerizers (DRACOs) which have successfully terminated viral infections. . . .


http://www.dailytech.com/MIT+Researchers+May+Have+Found+Cure+for+the+Common+Cold+Other+Viruses/article22569.htm

My Sentiments Exactly

Yes, yes, I know what you are going to say … about how the markets allow corporations to raise capital in order to expand … yadda, yadda, yadda!

But, while this is a function of the markets, it is not the purpose. The purpose is to make a very few people very wealthy at the expense of the many. If the markets fail to fulfill this purpose, then the markets will cease to exist.

The wealth distribution takes place over very extended periods of time (decades, even generations). But, we see this concept operating over shorter time periods. Like the present, for example.

I believe the U.S. stock market has topped. I believe that the bear market we are entering will make a few people very wealthy at the expense of the many. The process is like the tide, coming in one wave at a time.
Some of the questions I ask myself often about any given market include:

How is this market going to best pick people’s pockets?
How will the market go about accomplishing this pocket picking?
How will the market impose the maximum penalty and pain on the maximum number of market participants (traders)?
What price action needs to take place to make the greatest number of market participants the most complacent?

Sometimes I guess wrongly on these questions, sometimes rightly.

The decline (“collapse” is a better description) in August forced many people out of the stock market — in fact, everyone who bought stock in the first seven months of 2011 (based on the indexes) lost money. I am sure tremendous liquidation occurred at or near the August low. The volume tells us this. The decline also turned a lot of traders bearish at the worst possible time. Perhaps you are one of those unfortunate traders who got short the week of August 8. I would have never advised you to take such an action, even though I was and am bearish. Timing is as important as direction. A good trades needs both things to occur.
So, the market forced long liquidation and trapped shorts in the same breath. Now the market is “running in the shorts.” The market is also giving confidence to those people who either bought for the bounce or stayed long during the early August “correction.”

The market’s current rally may even cause some people who blew out at the botton to buy back in now. Ugh! Those who shorted in the hole will get blown out. In the next act, those who buy stock in the days ahead, believing the worst is behind us, will end up with the fish hook in their mouths.

I remain short Sept. S&P futures. While I do not like losing unrealized profits, I will not take a loss on my trade. Take a look at the weekly and daily charts and ask yourself this question — which seems to be more powerful, the H&S top above the market or the dinky little double-type bottom under the market? In fact, the weekly graph does not even display a bottom.


I am looking for a spot to increase my short leverage. A hard retest of the top followed by a one-day reversal would be awesome. This may not happen, but if it does I will be ready. What ever happens, you can be assured of one thing – the markets are about redistributing wealth from the many to the few.


http://peterlbrandt.com/the-purpose-of-the-markets-is-to-redistribute-wealth-from-the-many-to-the-few/

Saturday, August 27, 2011

Over Sold?

Chart

In a bull (rising) market or a neutral (sideways) market, oversold conditions tell us that sellers have left the building and that a price advance is likely. The message is especially compelling when oversold conditions exist in all three time frames. However, in a bear market indicators have to be viewed with a negative bias, and we are definitely in a bear market. (See last week's article on long-term sell signals.)

When the market is oversold in a bear market, our first concern should be that prices, rather than advancing, will slide even lower because the buyers have left the building. That doesn't mean that the market can't rally. It does mean that the market is less likely to rally, and, when it does, the rally is likely to fail. On the left side of the chart I have annotated a portion of the last bear market, which illustrates dismal price performance in spite of oversold indicators.
Bottom Line: Indicators need to be interpreted wthin the context of the overall market trend. Currently the market is oversold in a bear market, so the best we can hope for is a rally that will fail before it can make new highs. That we have seen the final low of the bear market is unlikely because bear markets usually last longer than this.


Wednesday, August 24, 2011

Some Perspective


"Nothing will unnerve the paper gold shorts more quickly and do more to undercut their confidence than to strip them of the real metal and force them to come up with more hard gold bullion to make good on deliveries. "Stand and Deliver or Go Home" should be the rallying cry of the gold longs to the paper gold shorts." --Trader Dan Norcini
My Dear Extended Family:

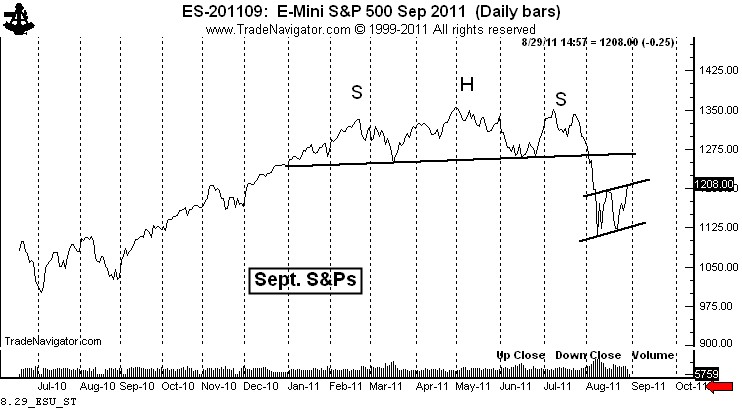
What is at the heart of the violent markets? The answer is Skier Illustration number 3.

Will Bernanke do something in the coming week? It does not matter in reality as business conditions are headed to a double dip in which the double could be wild on the downside. The Fed will act because of the balance sheet condition of the US and Western world financial industry devoid of false OTC derivative values.

Liquidity will be provided and Skier Illustration number 3 will take place, taking the US dollar lower and Gold to higher highs either now or very soon. As far as margin rates are concerned, they will rise to cash on both gold and silver before either sees full valuation.


You have heard from me on this gold reaction. Now hear from the extremely accurate Alf fields:

"The good news is that once the anticipated correction has been completed, gold should commence intermediate Wave 3 of Major 3. This should be the longest and strongest up-wave of the entire Bull Market. Expect high volatility and very high prices during that up-wave."

Now let's here from Kenny Adams, Master Technician, on long term trends:

"So far we have the potential for a topping action that may generate a moderate to deep correction - but not a long extended correction - not a termination of a bull trend."

Now lets hear from Dean of Gold, Harry Schultz:

"Don't bother me now. Call me when gold trades at $2400."

So stop worrying. At the worst this is a fast, deep correction before much, much higher prices for Gold.

Respectfully,
Jim

No End In Sight!

Monday, August 22, 2011

$2000 Looks Likely Then a Pullback

Love This Idea


There are really good chart patterns … then there are great chart patterns. The Soybean Meal chart story is among the most bullish I have seen in quite some time.
A picture is worth a thousand words. A chart is certainly worth half as many. So I will try to tell a narrative in as few words as possible.
The story in Soybean Meal is to be found on the quarterly graph, as shown below. This graph shows that the advance in early 2008 completed a massive 35-year rectangle. I bet you 5-minute chart traders have never conceived of such a long pattern. This configuration has a target of 620. A point and figure chart would project much higher.

I can recall a similar massive rectangle on the quarterly chart of another market. The market was Copper. See the chart below — and note the outcome. By the way, for all you macro/fundo guys and gals, China has become the world’s largest importer of Soybeans and Soybean products. Sound familiar?


http://peterlbrandt.com/soybean-meal-one-of-this-years-most-bullish-charts/

Times Are Tough...Can't Even Afford Ski Mask...Oh Well Dirty Under Will Do


What's The Deal With Corn Dogs and Politicians

Yeah...That Worked?

This Week

----- Monday, Aug 22nd -----

8:30 AM ET: Chicago Fed National Activity Index (July). This is a composite index of other data.

10:00 AM: Mortgage Bankers Association (MBA) 2nd Quarter 2011 National Delinquency Survey (NDS)

Click on graph for larger image in graph gallery.

This graph shows the percent of loans delinquent by days past due.

The MBA reported 8.32% of mortgage loans were delinquent at the end of Q1, seasonally adjusted, and another 4.52% were in the foreclosure process (total of 12.84%). The deliquency rate probably decreased in Q2, but the in-foreclosure rate probably increased.

Expected: The Moody's/REAL Commercial Property Price Indices (commercial real estate price index) for June.

----- Tuesday, Aug 23rd -----

10:00 AM: New Home Sales for July from the Census Bureau.

This graph shows New Home Sales since 1963.

The dashed line is the June sales rate of 312 thousand (SAAR).

The consensus is for a slight increase to 313 thousand SAAR in July.

10:00 AM: Richmond Fed Survey of Manufacturing Activity for August. The consensus is for the index to be at minus 7, down from minus 1 in July. (below zero is contraction).

----- Wednesday, Aug 24th -----

7:00 AM: The Mortgage Bankers Association (MBA) will release the mortgage purchase applications index. This index has been very weak over the last several months, although refinance activity probably increased sharply last week.

8:30 AM: Durable Goods Orders for July from the Census Bureau. The consensus is for a 2.0% increase in durable goods orders after decreasing 2.1% in June.

10:00 AM: FHFA House Price Index for June 2011. This is based on GSE repeat sales and is no longer as closely followed as Case-Shiller (or CoreLogic).

----- Thursday, Aug 25th -----

8:30 AM: The initial weekly unemployment claims report will be released. The consensus is for an increase to 415,000 from 408,000 last week.

11:00 AM: Kansas City Fed regional Manufacturing Survey for August. The index was at 3 in July.

----- Friday, Aug 26th -----

8:30 AM: Q2 GDP (second estimate). This is the second estimate for Q2 GDP from the BEA.

This graph shows the quarterly GDP growth (at an annual rate) for the last 30 years.

The first estimate was for 1.3% annualized growth in Q2. The consensus is for a downward revision to 1.1% annualized real GDP growth.

9:55 AM: Reuters/University of Mich Consumer Sentiment final for August. The consensus is for a slight increase to 56.0 from the preliminary August reading of 54.9.

10:00 AM: Fed Chairman Ben Bernanke speaks at the Federal Reserve Bank of Kansas City Economic Symposium, Jackson Hole, Wyoming, "Near- and Long-Term Prospects for the U.S. Economy"

Saturday, August 20, 2011

This World Is So Smurfed Up That I Have Decided To Speak Hereon in Smurf!


Genius Boy

13-Year-Old Looks at Trees, Makes Solar Power Breakthrough

Aidan Dwyer did a much better job on his7th grade science project than any of us. While on a wintertime hike in the Catskills, he noticed the branches of trees held a spiral pattern as they ascended. He wondered if that could possibly serve some purpose, looked into it, and learned about the Fibonacci sequence, which is a mathematical way of describing a spiral. Then he studied tree branches more closely and found their leaves adhered to the sequence. Then he figured out that if he arranged solar panels the way an oak tree arranged its leaves, they were 20 to 50 percent more efficient than the standard straight-line solar arrays.          


http://www.theatlanticwire.com/technology/2011/08/13-year-old-looks-trees-makes-solar-power-breakthrough/41486/#.Tk6BECRoWxM.reddit

Thursday, August 18, 2011

Dollar Down and Market Down


In recent weeks I have expressed an extremely bearish technical perspective on the U.S. stock market. Then yesterday I posted a possible bearish interpretation on the U.S. Dollar.
Apparently I stepped into something brown and sticky. I have received comments that the U.S. stock market and the U.S. Dollar have a strong inverse correlation — thus how can a bear case be made for both at the same time?
Yesterday my good friend, a fellow blogger and an excellent technician, Bob Sinn (http://bit.ly/nE7mVm or www.robertsinn.com) thought the subject could make interesting fodder. I agree. Bob and I have very constructively gone back and forth on various trading subjects in the past. I think we both (and our readers) gain from such dialog.
How can stocks and the greenback both go down? Here is my thoughts on the subject. I am looking forward to Bob’s response.
1. The idea that the two markets are polar opposites is current conventional wisdom. I don’t trust conventional wisdom.
2. I believe all markets must be traded on the merits of their own charts. I am not able to place an order for the U.S. Dollar in the S&P pit. I trade price and price alone. All  the time I hear how one market cannot do such and such because another market is doing such and such.
3. High inverse (or positive) correlations between two different markets do not last forever. The chart below stacks the U.S. Dollar ($DX_F$DX) and $SPY charts. Note periods when both markets advanced (A), when the US$ dropped, but $SPY ended up going sideways (C) and when $SPYadvanced, but US$ chopped sideways (B).
The next chart is $SPY expressed in terms of the U.S. Dollar Index price ($SPY divided by $DX). In the past 13 years $SPY has ranged from two times the price of $DX to 80 percent of the price of$DX. This is not high correlation in my mind.


4.  The marketplace finds all kinds of reasons why two markets must go in different directions. And for long periods of time the inverse correlation may exist. But my experience is that when a certain correlation ends, it ends big time. And most often, the reasons for the change do not become known for a long period of time. Macro economics create strange forces. I think it is a mistake to project current understandings forever into the future.


http://peterlbrandt.com/the-us-and-u-s-stock-market-both-down-how-is-this-possible/

Tuesday, August 16, 2011

Amazing Parallel

This year’s tumble in U.S. stocks mirrors the Japanese selloff that began 11 years ago, an indication to hedge fund TTN AG that American equities may have further to fall.


The CHART OF THE DAY shows the pattern of gains and losses in the MSCI USA Index has followed the dollar-denominated MSCI Japan Index with an 11-year lag since 1990. While the U.S. gauge has retreated about 15 percent from this year’s high in April, the Japanese measure sank more than 50 percent during the slide that started in April 2000, data compiled by Bloomberg show.

There is a bounce in here, but my best guess is that there is more downside work to come.
Note: Where our Fed stepped up and flooded the system with liquidity, the Japanese central bank did not.Whether that means the US avoided a Japan like decade plus long recession, or merely delayed it, has yet to be determined . . .


http://www.ritholtz.com/blog/2011/08/turning-japanese-spx-vs-nikkei-index-10-year-lag-2/

Friday, August 5, 2011

OMG...1.42 Mark

Dedicated from Standard's Poor's Rating Agency to the US Treasury Dept


Word of the Day...Vigilant

110805indu

110805tran

Advice for the young at heart...Sell your stocks when the averages return to test the former break level...This smells like this is just the beginning of a substantial move lower.  Be prepared and be defensive, no time to be a hero and stand in front of a freight train.  God Speed...Lotion Boy

Cheer Up!


The stock market tanked yesterday and people are grouchy.
But I learned something in college economics that has always
stuck with me. Investors are cheered up by the sight of flowers. 
Let’s hope this works.
http://gordonkeith.wordpress.com/2011/08/05/white-flowers-friday/

Tuesday, August 2, 2011

Dirty or Innocent?

Thank Me Later


This Will Be Only Remotely Entertaining If She Is Naked


SPRINGFIELD, Mass. (AP) - Octomom Nadya Suleman isn't done taking punches.
Octomom to take more punches in boxing match
The Springfield, Mass., newspaper The Republican reports that Celebrity Boxing Federation promoter Damon Feldman announced Monday that Suleman will be the featured fighter in a bout in Springfield, 90 miles west of Boston.

Suleman drew criticism and was dubbed the Octomom in 2009 when she gave birth to eight babies. She was an unemployed single mother who already had six children. She says she was addicted to having children. Her octuplets are the world's longest-surviving set.

Feldman says he's looking for a woman who wants to get in the ring and "fight this well-known mom."

The fight will consist of three 1-minute rounds. The women will wear oversized gloves and protective head gear.

Suleman fought in a similar match in New Jersey in June. It was a draw.


http://www.komonews.com/news/entertainment/126558538.html

Fucktards!

California Assembly refuses to make public its members' budgets


The California Assembly says the public has no right to see lawmakers' current office budgets and spending projections, documents that could show whether punishment is doled out for key votes.
Assemblyman Anthony Portantino raised the issue last month, saying that his budget was slashed shortly after casting the lone Democratic vote in the Assembly against this year's controversial budget.

Read more: http://www.sacbee.com/2011/08/02/3810155/california-assembly-refuses-to.html#ixzz1Tu4MiPcl


Monday, August 1, 2011

Trending the Wrong Way

[Chart]

Busy Week Ahead


----- Monday, Aug 1st -----

10:00 AM ET: ISM Manufacturing Index for July. The consensus is for a decrease to 54.3 from 55.3 in June.

10:00 AM: Construction Spending for June. The consensus is for no change in construction spending.

----- Tuesday, Aug 2nd -----

8:30 AM: Personal Income and Outlays for June. The consensus is for a 0.2% increase in personal income in June, and a 0.1% increase in personal spending, and for the Core PCE price index to increase 0.2%. The revisions will show significantly lower consumption earlier this year.

All day: Light vehicle sales for July. Light vehicle sales are expected to increase to 11.9 million (Seasonally Adjusted Annual Rate), from 11.4 million in June.

Vehicle SalesThis graph shows light vehicle sales since the BEA started keeping data in 1967. The dashed line is the June sales rate.

Edmunds is forecasting: "Toyota appears to be well on its way toward recovery following its new car sales and inventory struggles over the past few months, according to Edmunds.com’s July 2011 U.S. automotive sales forecast.
...
Edmunds.com estimates ... a Seasonally Adjusted Annualized Rate (SAAR) of 12.3 million light vehicles, nearly one million more than the 11.4 million SAAR reported in June."

----- Wednesday, Aug 3rd -----

7:00 AM: The Mortgage Bankers Association (MBA) will release the mortgage purchase applications index. This index has been very weak over the last couple months suggesting weak home sales through summer (not counting all cash purchases).

8:15 AM: The ADP Employment Report for July. This report is for private payrolls only (no government). The consensus is for +100,000 payroll jobs in July, down from the +157,000 reported in June.

ISM Non-Manufacturing Index10:00 AM: ISM non-Manufacturing Index for July. The consensus is for a slight increase to 54.0 in July.

This graph shows the ISM non-manufacturing index (started in January 2008) and the ISM non-manufacturing employment diffusion index. The June ISM Non-manufacturing index was at 53.3%, down from 54.6% in May. The employment index increased in June to 54.1%, up from 54.0% in May. Note: Above 50 indicates expansion, below 50 contraction.

10:00 AM: Manufacturers' Shipments, Inventories and Orders for June (Factory Orders). The consensus is for a 1.0% decrease in orders.

----- Thursday, Aug 4th -----

8:30 AM: The initial weekly unemployment claims report will be released. The consensus is for an increase to 403,000 from 398,000 last week.

----- Friday, Aug 5th -----

8:30 AM: Employment Report for July.

Payroll Jobs per MonthThe consensus is for an increase of 75,000 non-farm payroll jobs in July, up from the 18,000 jobs added in June. I'll take the under.

This graph shows the net payroll jobs per month (excluding temporary Census jobs) since the beginning of the recession. The consensus forecast for July is in blue.

The consensus is for the unemployment rate to hold steady at 9.2% in July.

Percent Job Losses During RecessionsThis second employment graph shows the percentage of payroll jobs lost during post WWII recessions. This shows the severe job losses during the recent recession.

Through the first six months of 2011, the economy has added 757,000 total non-farm jobs or just 126 thousand per month. There have been 945,000 private sector jobs added, or about 158 thousand per month. This is a better pace of payroll job creation than last year, but the economy still has 6.98 million fewer payroll jobs than at the beginning of the 2007 recession.

3:00 PM: Consumer Credit for June. The consensus is for a $5.1 billion increase in consumer credit.


http://www.calculatedriskblog.com/2011/07/schedule-for-week-of-july-31st.html