Total Pageviews

Tuesday, April 30, 2013

What Lies Beyond


Unemployment

10-year Yield & Small-caps Not Confirming Recent Market Rally


Charts etc., April 29, 2013. Well done. When these things begin to matter, they can matter a lot.


For the last several weeks, the 10-year T-bond yield has been declining as the stock market (S&P 500) has been rising or working sideways: 

Source: Bloomberg
Over time, T-bond yields tend to be positively correlated with the stock market:
Source: Bloomberg

In general, as the stock market rises, so too does the 10-year yield, and vice versa. There are a few good reasons for why this correlation should hold, one being rising T-bond yields infer the economy is strengthening. Typically low government bond yields are due in large part to the Fed keeping rates low for the benefit of an anemic or ailing economy. Signs of economic growth are going to make it less necessary for the Fed to maintain such low rates, in effect framing rising yields as a bullish indication for equities. Another reason rising yields are bullish for the stock market is very simple: it implies money is getting re-allocated out of bonds (yields rise) and most likely into equities. 

And yet as you can see in the first chart above, the 10-year yield is not confirming this recent rally in the stock market, a potential red-flag.

Also note that small-cap stocks likewise have not been confirming this recent S&P 500 move: 

Source: Bloomberg
The Russell 2000 Index has been trending lower since mid-March, making lower highs as the S&P 500 made a new high and is trending higher. It doesn't always hold true, but more often than not one wants to see smaller-cap stocks confirm the move of larger-caps. An index like the S&P 500 is very top-heavy, reflecting the ups and downs of several mega-caps, whereas the Russell 2000 Index is a much flatter and more equal-weighted benchmark, offering a better representation of market breadth. Based on the chart above, the average stock is not doing as well as the S&P 500 would suggest -- another potential red-flag.

Sunday, April 28, 2013

Walmart (aka. America) Is In The Shits

http://i.imgur.com/41ZCPBR.jpg

Henry Blodgett and Business Insider Mouth Piece of The New World Order


I used to like Business Insider as a fluff news site....but they have now become one of the biggest mouth pieces for wall street, the fed and it's banking cronies....This fairly new start up web site was developed by its founder and first rate white collar criminal, Henry Blodgett and his cabal of elitist thugs. Their goal is becoming apparent, indoctrinate us all to the New World Order.


In case you don't remember who Blodgett is, maybe this will remind you....


"In 2002, then New York State Attorney General Eliot Spitzer, published Merrill Lynch e-mails in which Blodget gave assessments about stocks which allegedly conflicted with what was publicly published.[5] In 2003, he was charged with civil securities fraud by the U.S. Securities and Exchange Commission.[6] He agreed to a permanent ban from the securities industry and paid a $2 million fine plus a $2 million disgorgement.[7]"

Henry Blodgett has never gotten my ire up before, but when his colleague and fellow elitist cronie penned this I became livid.

"Why should the decline of a relatively irrelevant commodity creating such a reaction?

There's two reasons for this:
  • Gold bugs are frequently jerks.
  • This vindicates the economic ideas of the economic elites.
The latter point is the most significant.
To respond to the economic crisis, economists and mainstream policy makers have favored highly unusual policy measures (massive Fed balance sheet expansion, massive stimulus, etc.). These ideas are usually based on years of traditional economic research (Keynesianism, monetarism, etc.).
All of these ideas have been slammed by heterodox types like Austrian economists, who have warned of hyperinflation, and gold going to $10,000.
So the collapse in gold is not about gold, but about vindication for a large corpus of belief and economic research, which has largely panned out. It's great that our economic elites know what they're talking about, and have the tools at their disposal to address crises without creating some new catastrophe.
Things aren't great in the economy, but the collapse/hyperinflation fears haven't panned out, and the decline in gold is a manifestation of that."

Let me get this straight, HE WANTS TO VINDICATE THE ECONOMIC IDEAS OF THE ELITES!!!!  The same group of people that caused the collapse in the first case!!!!!!!!!!!!!


Am I insane or something!!!!!!!!! (Don't answer that! lol) He believes the TBTF Banks, bailed out by you and me remember? The elitist economist, who believed their was no housing bubble and Bernanke's Fed who just months and weeks before Bear Stearns collapsed told us all that the US economy was in great shape.  This idiot wants us to vindicate these traitors and wealth stealers!!!!!!!!!!!!


Well no sir.  I will not follow your lead. I will not delight in the manipulated decline of gold by the forces you work for, nor will I stand and cheer for the men and women that have brought pain and suffering to millions of Americans.  I deplore your elitist attitude and your Ivy league silver spoon swagging mouth that allows you to opine messages of absurdity to the people who will suffer the most from your reckless verbiage!!!!!!


All The Lonely People...

Sober Look, April 27, 2013

In spite of some improvements in the US job markets, labor force participation continues to decline.


The seasonality is driven by higher labor demand during warmer months (construction for example) or student summer jobs 

The traditional explanation of course is that people are discouraged by the lack of job opportunities and are simply "dropping out" of the labor force after having exhausted their unemployment benefits. But that's easier said than done. Most people need some sort of income to survive - so where does that income come from? A portion of the decline can be explained by households with two incomes going to one. But that's by no means all of it. Let's explore some recent trends that may explain what's really going on.

1. One common explanation is older workers retiring earlier and dropping out of the workforce. There is some anecdotal evidence for early retirement but the data doesn't support it. While participation rate by workers 55 years and older is not growing at the rate it did during the boom years, it's not declining either - which means it can't explain the declines in the chart above. Many people simply can't afford to retire.


2. Another explanation is that young people who can't find work are going to school. This trend is definitely contributing to the reduction in the overall participation rate. And the source of "income" for this group is of course the federal government in the form of student loans. Government-owned student loan balances continue to rise, as people "wait it out" at school while accumulating massive debt.


3. Another source of falling "official" employment participation is the unregistered workforce, as more people get paid "under the table". Indeed the underground economy is estimated to be at $2 trillion per year.
CNBC: - The shadow economy is a system composed of those who can't find a full-time or regular job. Workers turn to anything that pays them under the table, with no income reported and no taxes paid — especially with an uneven job picture.

"I think the underground economy is quite big in the U.S.," said Alexandre Padilla, associate professor of economics at Metropolitan State University of Denver. "Whether it's using undocumented workers or those here legally, it's pretty large."
4. Finally, nearly nine million people are now receiving social security disability checks. When unemployment checks run out, some people (nearly a quarter) shift to this other source of income (discussed here). This is certainly an important program, but it's amazing how many people get "injured" while they are on unemployment. The improving labor markets did reduce the growth rate of this group, but the number of people on disability continues to increase much faster than the population growth.

Source: SSA

Whether it's the spouse, the underground economy or the federal government providing the income, there is "life" after the unemployment checks stop coming. Meanwhile, the "official" labor participation rate keeps falling.

Friday, April 26, 2013

Buyer Exhaustion?

The Fat Pitch, April 25, 2013

Let's place the current rally in perspective to determine whether it is unusual or extreme.

Key points:


  • SPX is likely to close higher every month from November through April for the first time in 15 years. It's only the third such streak since 1980.
  • The current rally has gone up by a larger percentage than two-thirds of the multi-month rallies of the past 13 years.  With only one exception, its the biggest rally that didn't start at a major bottom (like 2009).
  • 2013 is the first time in 17 years that there hasn't been even a 5% retrace by May.
  • The gain over the past 6 months is 4 times greater than the average annual gain in SPX.

November-April all up: The rally started in November and has run 23 weeks. It has been up every month since, without a retrace. If SPX closes April above 1569, it will be the first time since 1998 that SPX has been up every month from November through April.

Since 1980, this has happened only 3 times. In other words, it's a once a decade occurrence. 90% of the time, at least one of these months will be down.

We've highlighted those 3 occurrences plus one other in the chart below.


Two things you'll notice is that in each case, SPX generally lost at least 7% over the following months but the longer term trend remained higher.

  • In 1982-83, SPX was up from August to April; from the May open the July low, it lost 9%. 
  • In 1995-96, SPX was up from November to June; from the May open to the July low, it lost 7%.
  • In 1997-98, SPX was up from November to April; in July and August, it lost 20%. 
  • In 1985-86, SPX was up from October to March. From the end of May to the September low, it lost 8%.

Percentage gain: Next, let's look at the gain in SPX during this rally. 
From low to high, SPX has gained 19% in the past 6 months. The average annual gain in SPX since 1980 is 9.5%, so the current rally is outperforming by four times

We've shown all the multi-month rallies of more than 5% since 2000 in the chart below. The percentages show the gain; the red shading shows the corrections (the width is equal to 3 months). The blue shading is the Flash Crash.

There have been 12 multi-month rallies since 2000; the current rally is the 13th. The average gain is 18% with a median gain of 17%. The current rally (19%) is larger than two-thirds of these. If it extends past SPX 1625, it will be longer than all but two. Bear in mind that we are only considering the biggest rallies, not all rallies. This one is exceptional even among the elite.

What makes this rally even more unusual is when it is occurring. Strong rallies after a steep fall (2003, 2009 and 2011) are the norm. But a strong rally like this is really only comparable to the one in 2006-07, which rose 21% before falling 7% over the next month. If SPX repeats that pattern, it will rise to 1625 and then fall to 1510. The good news is it rose another 15% later in 2007. The rest, of course, is history.

Year-to-date: Readers of this blog will recall that SPX has a strong tendency to correct at least 5% before the first week in April. Since 1980, a 5% correction has taken place before before the first week in April 85% of the time. That hasn't happened this year. In fact, this will be the first time it hasn't happened by May in 17 years (1996). It is, in other words, a very unusual start to the year. Read further here

Strength of the rally: Another way to measure the strength of the rally is compare the gain over a period of time. We can easily do that by looking at the difference between two moving averages; a powerful rally will create a wide spread in the averages.
The chart below looks at the difference between the 13 and 34-ema over the past 15 years. The vertical lines show the other times when the rally was as strong as this one.

The message from this chart is similar to that from the other charts above. There is a pattern of buyer exhaustion that ensues over the following months, with the indices either moving sideways for a several months (1998, 2004, 2011) or severely correcting (2007, 2010, 2012).

Thursday, April 25, 2013

Stalinism of NYSE


War On Terror Is Lost


Nothing Short of Spectacular

Mark J. Perry, Carpe Diem, April 24, 2013

oil

The Department of Energy reported today that the US produced an average of 7.326 million barrels of oil per day (bpd) last week, reaching a new 21-year record high for domestic oil output (see chart above). The last time that US oil production exceeded 7.3 million bpd was the week ending April 17 in 1992, exactly 21 years ago. Last week’s oil output was above production for the same week in 2012 by almost 20% and above oil output two years ago by 31%.

Almost entirely due to the breakthrough drilling technologies of hydraulic fracturing and horizontal drilling that started accessing oceans of shale oil in North Dakota and Texas toward the end of 2008 (see arrow in chart), US oil output has increased by 46.5%, from about 5 million bpd in early 2009 to now more than 7.3 million bpd. The spectacular rise in US oil output over the last four years, and especially during the last two years, completely reversing several decades of declining US oil output in such a short period of time, is nothing short of phenomenal.

Welcome to “Saudi America.”

Wednesday, April 24, 2013

America Is Turning Into A Hell Hole

America The Fallen: 24 Signs That Our Once Proud Cities Are Turning Into Poverty-Stricken Hellholes

Hellholes - Photo by LyzadangerWhat is happening to you America?  Once upon a time, the United States was a place where free enterprise thrived and the greatest cities that the world had ever seen sprouted up from coast to coast.  Good jobs were plentiful and a manufacturing boom helped fuel the rise of the largest and most vibrant middle class in the history of the planet.  Cities such as Detroit, Chicago, Milwaukee, Cleveland, Philadelphia and Baltimore were all teeming with economic activity and the rest of the globe looked on our economic miracle with a mixture of wonder and envy.  But now look at us.  Our once proud cities are being transformed into poverty-stricken hellholes.  Did you know that the city of Detroit once actually had the highest per-capita income in the United States?  Looking at Detroit today, it is hard to imagine that it was once one of the most prosperous cities in the world.  In fact, as you will read about later in this article, tourists now travel to Detroit from all over the globe just to see the ruins of Detroit.  Sadly, the exact same thing that is happening to Detroit is happening to cities all over America.  Detroit is just ahead of the curve.  We are in the midst of a long-term economic collapse that is eating away at us like cancer, and things are going to get a lot worse than this.  So if you still live in a prosperous area of the country, don't laugh at what is happening to others.  What is happening to them will be coming to your area soon enough.
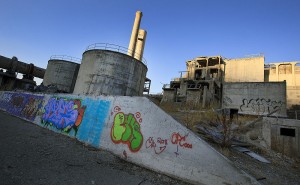
The following are 24 signs that our once proud cities are turning into poverty-stricken hellholes...
#1 According to the New York Times, there are now approximately 70,000 abandoned buildings in Detroit.
#2 At this point, approximately one-third of Detroit's 140 square miles is either vacant or derelict.
#3 Back during the housing bubble, an acre of land in downtown Phoenix, Arizona sold for about $90 a square foot.  Today, an acre in downtown Phoenix sells for about $9 a square foot.
#4 The city of Chicago is so strapped for cash that it is planning to close 54 public schools.  It is being estimated that Chicago schools will run a budget deficit of about a billion dollars in 2013.
#5 The city of Baltimore is already facing unfunded liabilities of more than 3.2 billion dollars, but the city government continues to pile up more debt as if it was going out of style.
#6 Today, the murder rate in East St. Louis is 17 times higher than the national average.
#7 According to USA Today, the "share of jobs located in or near a downtown declined in 91 of the nation's 100 largest metropolitan areas" between 2000 and 2010.
#8 Between December 2000 and December 2010, 48 percent of the manufacturing jobs in the state of Michigan were lost.
#9 There are more than 85,000 streetlights in Detroit, but thieves have stripped so much copper wiring out of the lights that more than half of them are not working.
#10 The unemployment rate in El Centro, California is 24.2 percent, and the unemployment rate in Yuma, Arizona is an astounding 25.6 percent.
#11 It has been estimated that there are more than 1,000 homeless people living in the massive network of flood tunnels under the city of Las Vegas.
#12 Violent crime in the city of Oakland increased by 23 percentduring 2012.
#13 If you can believe it, more than 11,000 homes, cars and businesses were burglarized in Oakland during 2012.  That breaks down to approximately 33 burglaries a day.
#14 As I have written about previously, there are only about 200 police officers assigned to Chicago's Gang Enforcement Unit to handle the estimated 100,000 gang members living in the city.
#15 The number of murders in Chicago last year was roughly equivalent to the number of murders in the entire country of Japan during 2012.
#16 The murder rate in Flint, Michigan is higher than the murder rate in Baghdad.
#17 If New Orleans was considered to be a separate nation, it would have the 2nd highest murder rate on the entire planet.
#18 According to the Justice Department’s National Drug Intelligence Center,  Mexican drug cartels were actively operating in 50 different U.S. cities in 2006.  By 2010, that number had skyrocketed to 1,286.
#19 Back in 2007, the number of New York City residents on food stamps was about 1 million.  It is now being projected that the number of New York City residents on food stamps will pass the 2 million markthis summer.
#20 The number of homeless people sleeping in the homeless shelters of New York City has increased by a whopping 19 percent over the past year.
#21 As I noted yesterday, approximately one out of every three children in the United States currently lives in a home without a father.
#22 In Miami, 45 percent of the children are living in poverty.
#23 In Cleveland, more than 50 percent of the children are living in poverty.
#24 According to a recently released report, 60 percent of all children in the city of Detroit are living in poverty.
Railroad In Milwaukee
As I mentioned at the top of this article, the decline of the city of Detroit has become so famous that it has actually become a tourist attraction.  The following is a short excerpt from an article in the New York Times...
But in Detroit, the tours go on, in an unofficial capacity. One afternoon at the ruins of the 3.5-million-square-foot Packard Plant, I ran into a family from Paris. The daughter said she read about the building in Lonely Planet; her father had a camcorder hanging around his neck. Another time, while conducting my own tour for a guest, a group of German college students drove up. When queried as to the appeal of Detroit, one of them gleefully exclaimed, “I came to see the end of the world!”
For much more on the shocking decline of one of America's greatest cities, please see my previous article entitled "Bankrupt, Decaying And Nearly Dead: 24 Facts About The City Of Detroit That Will Shock You".
So are there any areas of the country that are still thriving?
Well, yes, there are a few.  In particular, those areas that are sitting on top of energy resources tend to be doing quite well for now.
One example is Texas.  In recent years people have been absolutely flocking to the state.  There are lots of energy jobs, the cost of living is low and there is no state income tax.
But overall, things are really tough out there.  Over the past decade America has lost millions of good jobs to off-shoring, advancements in technology and a declining economy.
Last year, the United States had a trade deficit with the rest of the world of more than half a trillion dollars.  Overall, the U.S. has run a trade deficit with the rest of the world of more than 8 trillion dollars since 1975.
All of that money could have gone to U.S. businesses and U.S. workers.  In turn, taxes would have been paid on all of that income which could have helped keep our cities great.
But instead, our politicians have stood idly by as we have lost tens of thousands of businesses and millions of jobs.  If you can believe it, more than 56,000 manufacturing facilities have closed down permanently in the United States since 2001.
We have allowed our economic infrastructure to be absolutely gutted, and so we should not be surprised that our once proud cities are turning into poverty-stricken hellholes.
And this is just the beginning.  The next wave of the economic collapse is rapidly approaching, and when it strikes unemployment in this country will eventually rise to a level that is more than double what it is now.
When that happens, I wouldn't want to be anywhere near our rotting, decaying cities.

Flash Crash

Joshua M Brown, The Reformed Broker, April 23rd, 2013.  If the perpetrators made any money off of this, they must have been very nimble.

flash crash 2013

It lasted three minutes and shaved about 150 points off the Dow Jones Industrial Average in the blink of an eye.

Near as we can tell, it all began when the Associated Press had its Twitter account hacked. An erroneous message went out that the White House was bombed. This was quickly debunked by members of the President's staff and several reporters for the AP and markets got back to normal sort of.

But what was seen cannot be unseen and we got a quick reminder about how close we always are to a market panic or meltdown - whether thanks to false news, real news or no news. Market structure is a joke at this point, the amount of volume accounted for by bots that shut themselves down automatically at the hint of turbulence is just absurd.

We did it to ourselves. We made it unprofitable for humans to make markets, which reduced the interest in small cap research and the IPO process. We further exacerbated things by allowing the exchanges to go for-profit - the only revenue stream they could find was selling access and data and capabilities to parasitic tech firms. They took the money - now it's the only money they actually make other than renting out the trading floor for cocktail parties and the Westminster Dog Show.

So now we have this atmosphere where a tweet from a hacked account can temporarily wipe out half a trillion dollars of wealth in minutes. Hope you're enjoying this!
Some other thoughts:

* Check out the chart below, this thing stopped dead right at the bottom of the opening gap (last night's closing level) on the S&P! Chart courtesy of my friend Stefan Scheplick:

scheplick

* People with stops in got screwed, supposedly those sales are being honored.
* Gold didn't rally when we though the White House was bombed. The Yen and the Treasury complex did. What did you learn?

* I have no idea how Wall Street's rank-and-file can function without access to social media, it's getting embarrassing that they have to pretend they're not using it. On the twitters, we noticed the commotion, the market's  reaction to it and the debunking of it before the news anchors could even be rushed into makeup. Maybe they'll read about it in the newspaper tomorrow.

* The fact that the bots shut themselves down is another reminder that the liquidity they provide is bullshit liquidity than no one really needs. As it's been phrased before, they provide a glass of water in a monsoon, but when you really need them to absorb sell orders, they're on the sideline, buffering. It's a joke.

Monday, April 22, 2013

Captions Please...WTF!!!!!!!!!!

http://i.imgur.com/Vbdf1aJ.jpg

Exploiting Our Fears

Ron Paul, The Cagle Post, 4/22/2013

This week, as Americans were horrified by the attacks in Boston, both houses of Congress considered legislation undermining our liberty in the name of “safety.” Gun control continued to be the focus of the Senate, where an amendment expanding federal “background checks” to gun show sales and other private transfers dominated the debate. While the background check amendment failed to pass, proponents of gun control have made it clear they will continue their efforts to enact new restrictions on gun ownership into law.
105517 600 Congress Exploits Our Fears to Take Our Liberty cartoons

While it did not receive nearly as much attention as the debate on gun control, the House of Representatives passed legislation with significant implications for individual liberty: the Cyber Intelligence Sharing and Protection Act (CISPA). CISPA proponents claim that the legislation is necessary to protect Americans from foreign “cyber terrorists,” but the real effect of this bill will be to further erode Americans’ online privacy.

Under CISPA, Internet corporations are authorized to hand over the private information of American citizens to federal agents, as long as they can justify the violation of your privacy in the name of protecting “cyber security”. Among the items that may be shared are your e-mails, browsing history, and online transactions.

Like the PATRIOT Act, CISPA violates the fourth amendment by allowing federal agencies to obtain private information without first seeking a warrant from a federal judge. The law also allows federal agencies to pass your information along to other federal bureaucrats — again without obtaining a warrant. And the bill provides private companies with immunity from lawsuits regardless of the damage done to anyone whose personal information is shared with the government.

CISPA represents a troubling form of corporatism, where large companies cede their responsibility to protect their property to the federal government, at the expense of their customers’ privacy and liberty. In this respect, CISPA can be thought of as an electronic version of the Transportation Security Administration, which has usurped the authority over airline security from private airlines. However, CISPA will prove to be far more invasive than even the most robust TSA screening.

CISPA and the gun control bill are only the most recent examples of politicians manipulating fear to con the people into giving up their liberties. Of course, the people are told the legislation is for “limited purposes,” but authority granted to government is rarely, if ever, used solely for the purpose for which it is granted. For example, the American people were promised that the extraordinary powers granted the government by the PATRIOT Act would only be used against terrorism. Yet soon after the bill became law, reports surfaced that it was being used for non-terrorism purposes. In fact, according to data compiled by the American Civil Liberties Union, 76 percent of the uses of the controversial “sneak-and-peak” warrants where related to the war on drugs!

Sadly, I expect this week’s tragic attacks in Boston to be used to justify new restrictions on liberty. Within 48 hours of the attack in Boston, at least one Congressman was calling for increased use of surveillance cameras to expand the government’s ability to monitor our actions, while another Senator called for a federal law mandating background checks before Americans can buy “explosive powder.”

I would not be surprised if the Transportation Security Administration uses this tragedy to claim new authority to “screen” Americans before they can attend sporting or other public events. The Boston attack may also be used as another justification for creating a National ID Card tied to a federal database with “biometric” information. The only thing that will stop them is if the American people rediscover the wisdom of Benjamin Franklin that you cannot achieve security by allowing government to take their liberties.

Sunday, April 21, 2013

Bonds Are Telling Us Something

All Star Charts, April 21st, 2013

US Treasury Bonds aren’t sexy. Trust me, I know. But neither were Staples and Healthcare for a long time right? And now, what’s hotter than a Johnson and Johnson, P&G, or a Coca-Cola? I almost can’t even say that with a straight face. But these are the names getting the attention these days, no question about it.

So when we think about US Treasury Bonds, we should at least give them a chance. With that said, let’s reflect for a minute and think about what just happened over the last 10 months. Last summer the world was ending, Greece was done, Eurozone was splitting up, Fiscal cliffs, debt ceilings, Elections….the media came up with every possible reason why we should sell stocks (see here). Well? We got a monster rally instead. Stocks did great. The more speculative the better actually, until just recently. But forget stocks for a minute. What about bonds? What did US Treasuries do during this 25% move in the S&P500 (30% for the Russell2000 and Mid-Cap 400)?

Bonds consolidated nicely. You couldn’t possibly have asked for better action out of this negatively correlated asset class. Here are two ETFs that I think tell the story well. Under market conditions where speculation ruled (in theory), the safe haven held its own. Here is a weekly bar chart of the iShares Barclays 20+ Year Treasury Bond Fund $TLT. Call me crazy, but this looks to me like your standard falling wedge within an ongoing uptrend:

4-21-13 tlt

And here is the shorter duration equivalent. 
$IEF is the iShares Barclays 7-10 Year Treasury Bond Fund. In this case, the upper and lower borders of the consolidation are parallel, forming more of a flag than a wedge, but the consequences are the same.

4-21-13 ief

These look like two continuation patters to me. Obviously the breakouts in each of these have to hold. 
Last week we suggested that Bond yields were breaking down and this certainly ties in with that. I’m very impressed with the health in Treasury Bonds during this last leg of the US Stock Market rally. So I think to err on the bullish side of bonds right now is warranted. I keep hearing about this secular “Great Rotation” out of bonds and into stocks. I’m sure it gets clicks and sells newspapers. But as always, we’ll look to price action to help us determine what’s rotating and what isn’t.

I’ll do my best to circle back and reevaluate this market again on the blog in a couple of weeks. But right now, it’s hard not to be encouraged by the action in government bonds.


A Thank You To My Viewers


Saturday, April 20, 2013

Crude Awakening


Richard Rhodes: Sharp Correction Ahead for Crude Oil?

ChartWatchers, April 20, 2013

Our attention has turned to the crude oil market, where a rather large "head & shoulders" top pattern is in development. The focus is upon how prices challenge and hold the 300-week moving average, and if not...whether neckline support is violated. A breakdown of these levels would lead to a virtual free-fall in prices towards the $51 target level.
Crude 4-20-13

Of course we are ones to wonder what the world economy and the world's stock markets would look like under such a scenario. If past is prelude, then we should expect a rather nasty correction...and it very well may be quick and sharp. Aware is prepared.

Friday, April 19, 2013

The Secret World of Gold


Paper Sell off Has Unleashed Physical Gold Demand


The following are 10 signs that the takedown of paper 

gold has unleashed an unprecedented global run on 

physical gold and silver...

#1 According to Zero Hedge, the U.S. Mint set a new all-time record for the number of gold ounces sold on Wednesday...

According to today's data from the US Minta record 63,500 ounces, or a whopping 2 tons, of gold were reported sold on April 17th alone, bringing the total sales for the month to a whopping 147,000 ounces or more than the previous two months combined with just half of the month gone.
#2 Precious metals dealers all over the United States are having a really hard time keeping up with demand right now.  According to Chris Martenson, many are warning customers to expect waiting times of five to six weeks at this point...
In the U.S., all of the dealers I talk to are reporting huge demand and brisk buying. Silver in any form is quite hard to come by unless you want to pay premiums of 20%+ per ounce above spot price. Delivery times are 5 to 6 weeks out now – that's an unusual situation.  If this recent slam was designed to scare people away from gold, it did not have that desired outcome; in fact, just the opposite.
#3 Individual dealers all over the country are confirming that we are seeing a voracious appetite for precious metals at the moment.  For example, the following is what a spokesperson for JM Bullionhad to say...
We still have certain things in stock, like 10 oz bars, while others, like Silver Eagles, are a bit of revolving inventory.
The shipments are going out as soon as inventory comes in.
Our main challenge right now is actually getting the silver into the boxes and shipped out – we have been experiencing astounding volume.
This appears to be a widespread phenomenon.  Just check out what other dealers are reporting...
“There has been a marked increase in demand since the plunge,” said Mark O’Byrne, executive director at Dublin-based investment and bullion specialist GoldCore, referring to the drop in gold prices seen Friday and Monday. Gold futures lost more than $200 an ounce, or over 13%, on those two days. They were at $1,392 an ounce, moving higher ahead of the close on Thursday.
GoldCore has seen more buying than selling on Wednesday and Thursday, with buy orders “lumpier and from high net worth clients, and with most of the selling in small orders of less than 50 ounces, said O’Byrne.
On Wednesday, David Beahm, executive vice president at Blanchard & Co., said his precious-metals investment firm has seen “2008-like demand” for gold since Monday.
#4 Large international banks are also experiencing tremendous demand for physical gold and silver by customers right now.  The following is what Keith Barron told King World News about what he is hearing...
At the Bank of Nova Scotia in Toronto the gold window has been absolutely swamped. I have confirmed there were people lined up in droves recently for multiple-hours at a time to buy gold and silver bars and coins....
I then confirmed with UBS today in Zurich, Switzerland, that they are experiencing exactly the same thing. They told me people are waiting in long lines for bullion related bars and coins. The physical market is incredibly tight, and there is a huge buying opportunity right here.
The damage in gold will not be long-term because physical supply is already drying up. Asian countries have been aggressively buying gold. This really is an unprecedented opportunity for investors. This takedown in the metals has created incredible demand for both gold and silver, and anyone who wants to unload dollars or euros and put them into gold because they don’t trust the currency, now is the time to do it.
#5 The demand for physical gold and silver is heating up over in Europe as well.  For example, the following is from an emergency message posted on the website of a precious metals dealer in the UK...
Due to the unprecedented demand triggered by the recent fall in the Gold Price we are currently not able to guarantee Next Day Delivery of orders.
We anticipate that all orders will be delivered within 7 days of receipt by us.
Whilst we appreciate that these delays are frustrating for our customers we would like to stress that all accepted orders are guaranteed at the order price and will be dispatched as soon as possible.
It is necessary for all of our staff to be utilised in fulfilling orders and we ask for your cooperation by not calling us to query delivery times. If you do need to contact us, please do so by e-mail and we will endeavour to respond within 48hrs.
#6 On the other side of the globe, demand for precious metals is skyrocketing as well.  According to Bloomberg, people are "running through the gate" to get gold in Australia...
Gold sales from Australia’s Perth Mint, which refines nearly all of the nation’s bullion, surged after prices plunged, adding to signs that the metal’s slump to a two-year low is spurring increased demand.
“The volume of business that we’re putting through is way in excess of double what we did last week,” Treasurer Nigel Moffatt said by phone, without giving precise figures. “There’s been people running through the gate.”
#7 Reuters is reporting that customers are waiting for up to three hours to buy gold in Japan...
A week ago, as the yen-denominated price neared a new peak, jewelry stores and gold merchants across Japan saw long lines of mostly older Japanese looking to cash in on unwanted jewelry and other items that they had held for years.
But on Tuesday, buyers outnumbered sellers by a wide margin. At Ginza Tanaka, the headquarters shop of Tanaka Holdings, gold buyers waited for as long as three hours for a chance to complete a transaction.
#8 According to a Chinese article quoted by the Blaze, there is a mad rush to buy gold in China right now...
People have to rush to buy gold … gold bullion out of stock yesterday, investors yesterday to spend as much as 600 million yuan to buy 20 kilograms of gold bars
The mad pursuit gold insufficiency is not just a game for the rich. Yesterday, the Yangcheng Evening News reporter learned from the East flowers to Bay store, many growers, pork traffickers, fishmonger recently put down his job went straight to the mall to buy gold.
#9 According to Reuters, dealers in Singapore are having significant trouble finding enough of a supply to keep up with the intense demand for gold that has erupted this week...
"People are actually buying everything, gold bars, gold coins. People are rushing to get a hand on it. We have a problem meeting the demand because we are unable to get new supply," said Brian Lan, managing director of GoldSilver Central Pte Ltd in Singapore.
#10 Bloomberg is reporting that over in India people are "flocking to stores" to purchase gold jewelry and coins...
Gold buyers in India, the world’s biggest consumer, are flocking to stores to buy jewelry and coins, betting a selloff that plunged bullion to a two-year low may be overdone.
“My daughter is just six months old, but I think it is never too early to buy gold,” said Sharmila Shirodkar, a 28- year-old housewife, while displaying a new pair of earrings she bought from a store in Mumbai’s Zaveri Bazaar. “I had been asking my husband every day if prices will go down more. I couldn’t wait anymore.”
If the big banks were trying to scare people away from gold and silver by crashing paper prices for those metals then they have utterly failed.

Instead of being frightened away, the global appetite for physical gold and silver is now more voracious than ever.

If the prices for gold and silver stay this low, we are eventually going to start seeing some very serious shortages in the marketplace.

And once reports of shortages of the actual physical metals become widely circulated, it will cause an "adjustment" in the marketplace that will shock everyone.

So hold on to your hats.  We are entering a period of time when there will be unprecedented volatility for the prices of precious metals.  It will be quite a roller coaster ride, but if you can handle the ups and downs it will be worth it in the end.


This article first appeared here at the Economic Collapse.  Michael Snyder is a writer, speaker and activist who writes and edits his own blogs The American Dream and Economic Collapse Blog