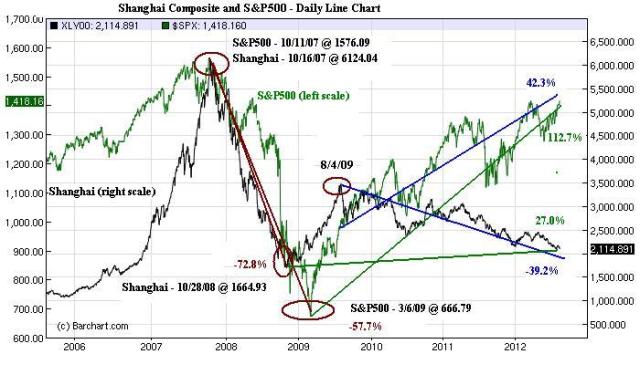
The only major global equity index which we monitor — and it is a big one – that is down for the year is the Shanghai Composite. The chart looks ugly and ready to break to new lows after its post crash peak of 3,477, way back in August 2009.
The Shanghai is down 39.2 percent from its post crash high while the S&P500 is up 42.3 percent over the same period. After falling 72.8 percent in a little over a year from its October 2007 peak, the Shanghai is now up a lowly 27 percent from it crash low. This compares to the S&P500, which fell 57.7 percent from the October 2007 high to the March 2009 low, and has now recovered 112.7% and continues to move higher.
A stunning divergence of the world’s two largest economies’ stock markets.
What makes us a little nervous is the Chinese stock market was the first to really collapse after peaking in the fall of 2007 and the first to bottom just a year later. We can relax a little as such a large and sustained divergence since August 2009 largely dismisses the notion that the Shanghai leads U.S. and global equity markets , however. The chart below illustrates even the Hang Seng, one of our favorite indicator species for global risk appetite, has decoupled from the Shanghai.
What does the continued poor performance of the Shanghai signal? Not sure, but either Chinese stocks are holding a massive fire sale and the Shanghai is setting up for a huge bounce or Air China is crash landing. And the latter, folks, ain’t good.
Another 2o percent drop in the Shanghai from current levels and it will be testing the lows of the 2008 crash. Keep this one one your radar. . . .

No comments:
Post a Comment