Open interest is the total number of contracts that are "open" for a futures contract. Every futures contract is simultaneously both a short position and a long position, with two separate parties each holding the obligation to either accept delivery of the goods, or pay for them at the agreed price and specifications.
Open interest data for T-Bond futures is unique in a couple of ways that make it very useful to watch. T-Bond futures differ from other types of futures contracts in that they can be created or closed at any time prior to the contract's expiration date. By contrast, stock index futures do not work that way, which is why you will see open interest in those contracts continuing to rise until just a few days before each quarterly expiration. A chart of it looks like a cross-cut saw blade, and thus is not useful for interpretive information about price direction.
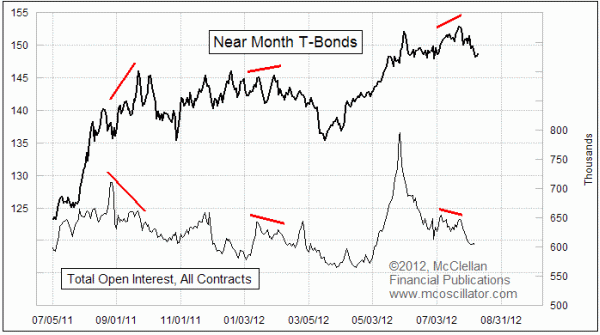
Because T-Bond open interest numbers can rise and fall at any time, there can be important information in the behavior of that data. Here is the key insight: open interest numbers for T-Bonds will tend to rise during periods when prices are moving in the direction of the dominant trend. T-Bond open interest will tend to fall as prices make corrective moves.
So the beauty of this is that if you see open interest rising, you can then infer that whichever direction prices are going right then is the dominant trend. That can be very useful information, so that you can know if you are trading with the trend or against it.
As we can see in this week's chart, open interest data can also give us some interesting divergences at important price tops for T-Bonds, like the one we just had recently. We featured this chart in the July 25, 2012 issue of our twice monthly newsletter, making the point that the divergence in July was signaling trouble for T-Bond prices. There had been a higher price high in July, but the open interest plot made a lower high which conveyed the message that "up" was no longer the direction of the dominant trend.
In the past, when there have been divergences this severe between prices and open interest, it has led to price declines that were more significant in magnitude than what we have seen thus far. The implication is that T-Bond prices have more distance yet to go downward in order to fulfill the implications of this open interest divergence.
Tom McClellan
Editor, The McClellan Market Report
Editor, The McClellan Market Report
No comments:
Post a Comment