Don’t expect a follow through trend anytime soon in U.S. stocks. This market is about to get volatile in a relatively tight range. At least, that is what the chart is telling me.
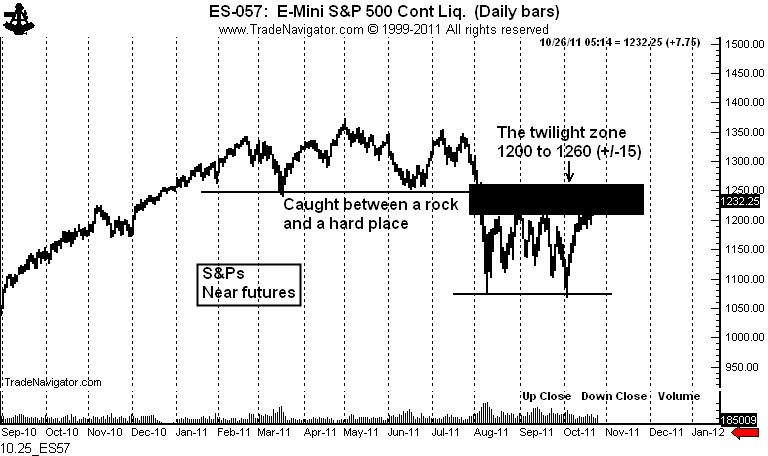
The chart of the nearby S&P futures contract shows that the market is between a rock and a hard place. Above the market exists a completed H&S top. This is a powerful reversal pattern (one that I believe will ultimately prevail).
Below the market is arguably a double bottom. The other indexes do not show a similar pattern, but the nearby S&P futures chart fulfills (barely) the general Edwards and Magee criteria for the pattern. The lows are more than a month apart, but the height is only 13% of the value (the criteria is 20%). Also, the rally from the Oct. 4 low should have experienced some pick up in volume, but not as much as was characterized by the first low.
In any case, I think this market will spend some time int he 1200 to 1260 range (+/- 15 to 20 points). The pattern above should keep the market from rallying too much. The pattern below will provide support.
We will see how this market situation becomes resolved. Stay tuned, sports fans.
No comments:
Post a Comment