A major bottom is significant for two reasons, both equally important for trading.
- The low price is in place
- The market should trend higher for an extended period of time
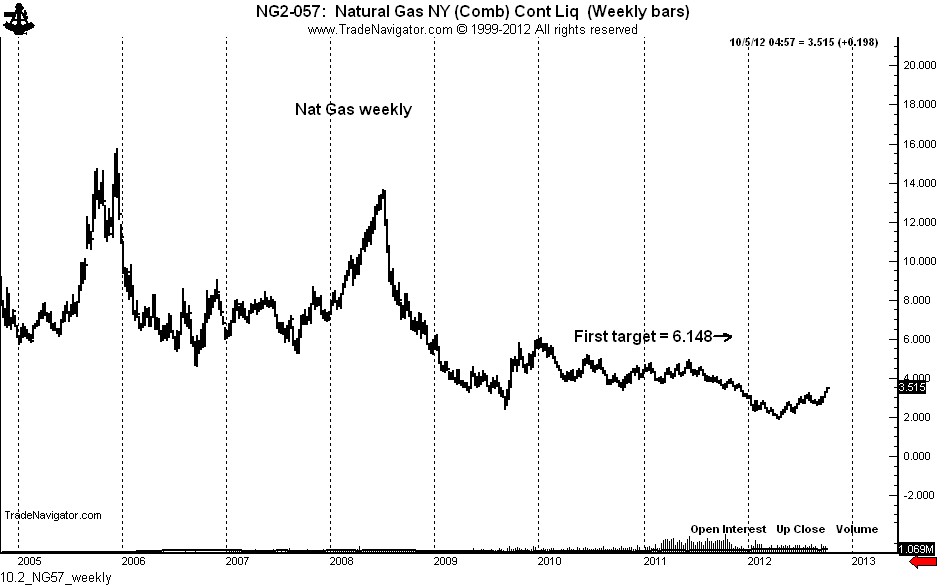
Thus is the case for Natural Gas. The weekly chart below shows that Nat Gas has been in a bear trend for 6-1/2 years. During this time the price of the nearby futures contract has declined from a high of 15.780 (Dec. 2005) to a low of 1.902 (Apr. 2012), a decline of 88%. I think this qualifies as a bear market.
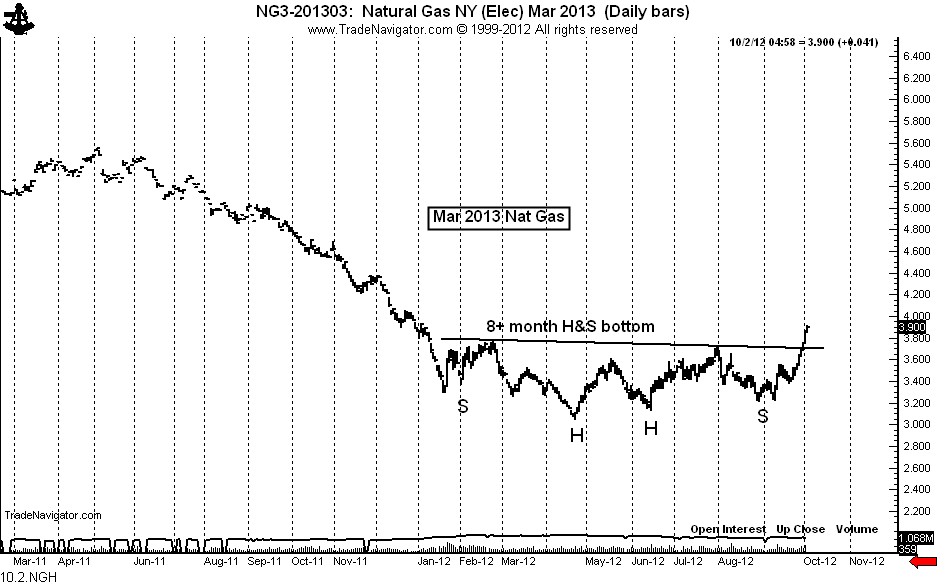
The daily chart now shows a decisive and massive complex H&S bottom in the March 2013 (and all other) contract(s).
A multi-year bullish trend has begun. The initial target is the 2010 high above 6.000. I must point out that trends are all subject to backing and filling. Nat Gas will be no different. The market has already had a good run. Traders should look for periods of weakness (10 to 15% dips) to be a buyer.
I AM NOT A FAN OF UNG (the ETF). It is possible that the price of futures could advance with the price of UNG actually declining.


No comments:
Post a Comment