Targets are 522, then 430
Several chart developments are worthy of note.
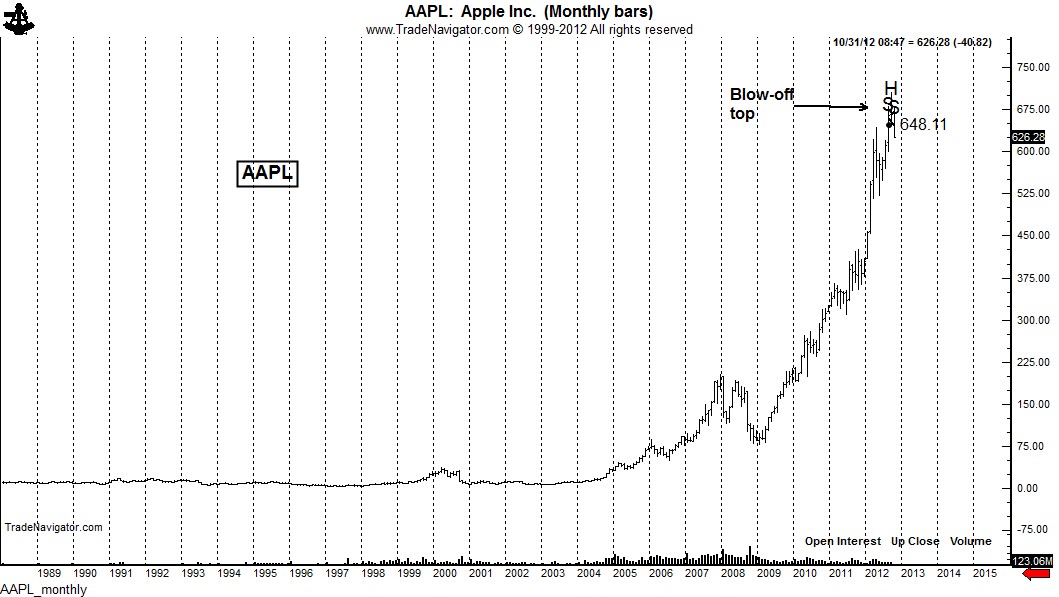
The monthly chart shows the 103-fold price increase from the early 2000s lows to the 2012 high. Such an advance goes a very long way to discount completely the bullish future of Apple ($AAPL). The advance during 2012 can be accurately described as a blow-off top.
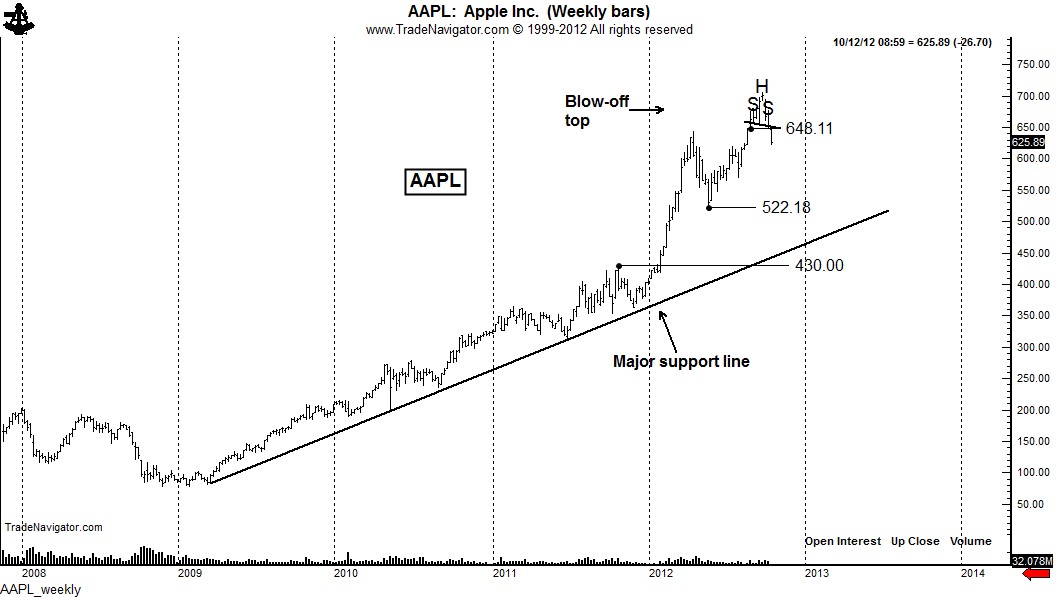
The weekly chart displays the dominant bull trendline connecting the 2009, 2010 and 2011 lows. This trendline will likely be the level to which the AAPL price will return.
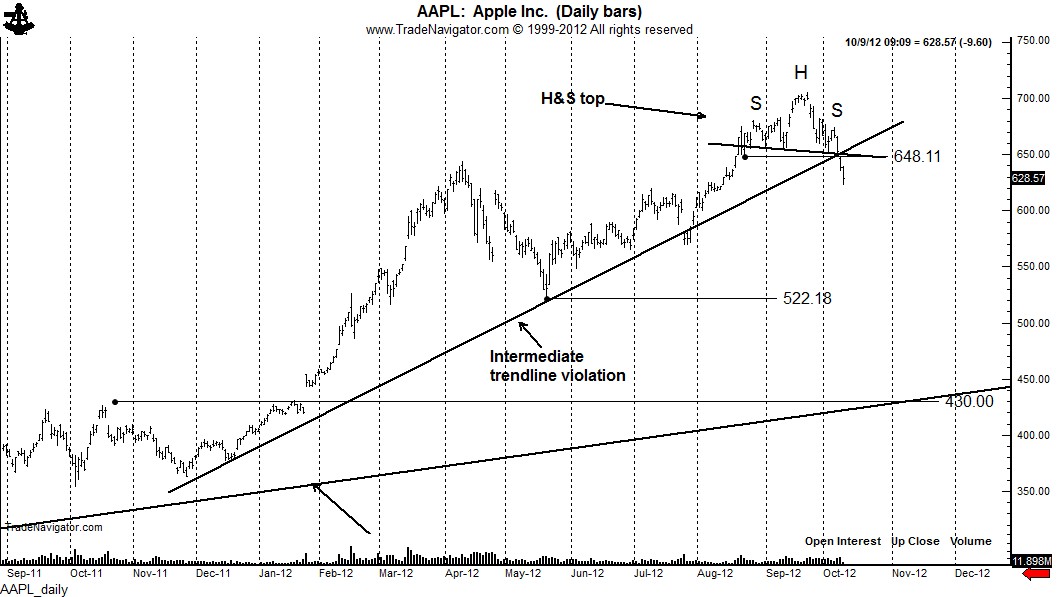
Finally, the daily graph displays a near-textbook H&S top completed on Oct. 8. Also note that the market has sliced through the intermediate trendline connecting the late 2011 and May 2012 lows. It is not unusual for an historic bull trend to end with a brief topping pattern.


No comments:
Post a Comment