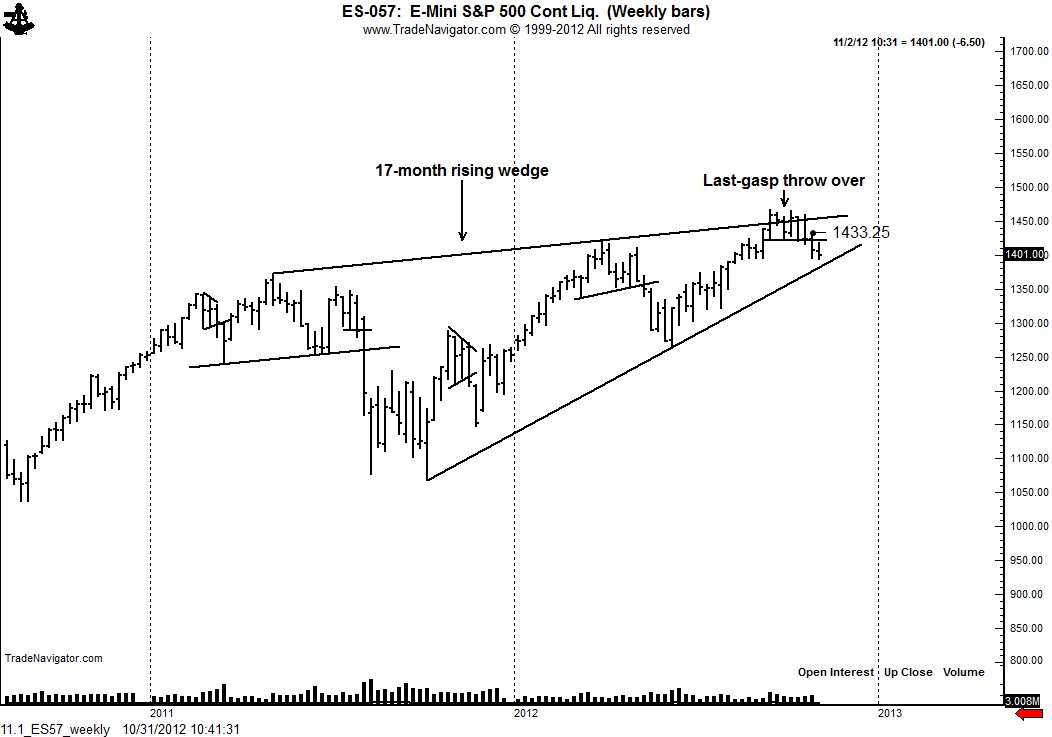
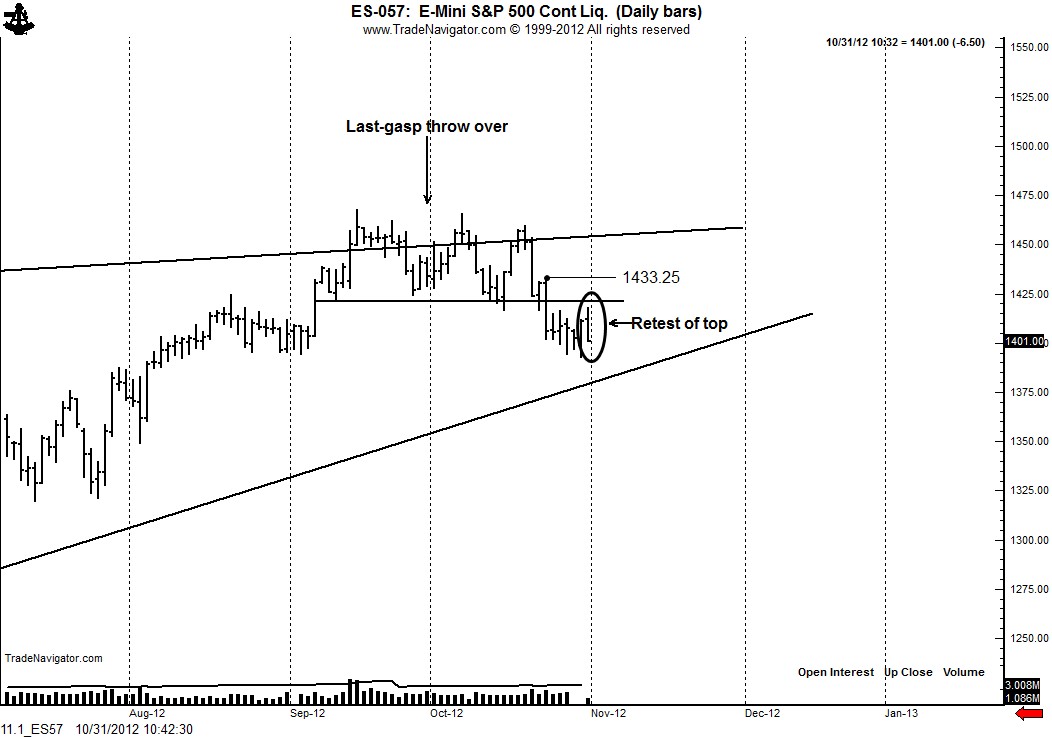
Top has been tested. Major wedge pattern now becomes the dominant chart pattern to watch.
The weekly S&P chart displays a large 17-month rising wedge pattern. The rising wedge is a classic bear pattern, resolved by a down move in about 70% of the cases. Notice that prices burst through the top boundary of the wedge in September and October, but could not follow through. This price action is known as a “last-gasp” blow-off.
The decline on the daily chart on Oct. 23 completed a 7-week triple top. The rally earlier today retested this top. Prices (as I draft this post) have reversed to the downside. If the market closes weak today, this price action would confirm the 7-week top and set up the rising wedge as the dominant pattern in play.


No comments:
Post a Comment