Bear trap on May 30 puts near-term outlook into doubt.
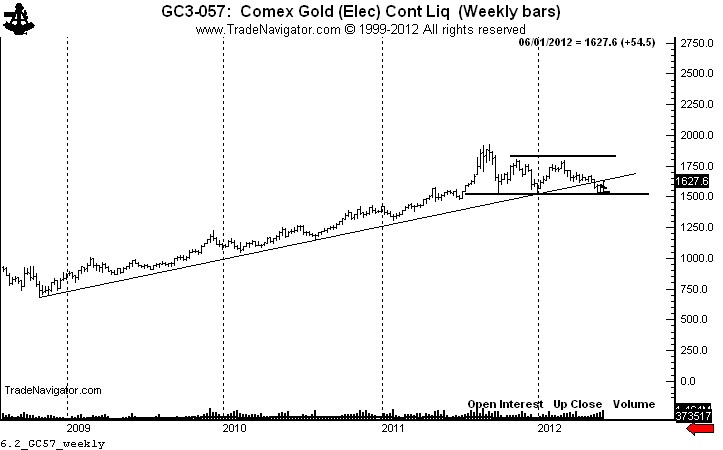
On May 30 I posted an analysis of Gold highlighting the importance of the $1500 to $1530 zone on the weekly chart.
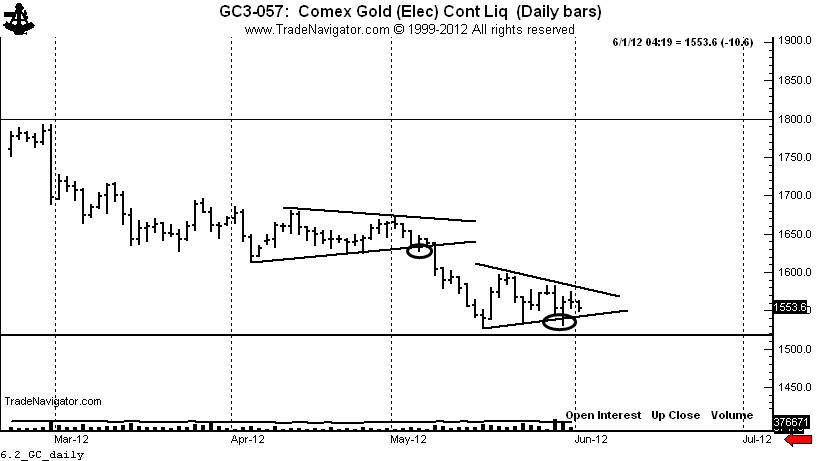
As a trader I look for sizable patterns and tend to ignore shorter-term technical developments. However, the price action last Wednesday, Thursday and Friday was textbook and deserves to be analyzed.
The decline on May 30 penetrated the May 23 low and tested the lower boundary zone of the massive descending triangle. The reversal on the close was a strong indication of a bear trap being sprung. Thursday was a quiet day on very little volume — but the fact the market did not go straight back down was positive. The huge advance on Friday was the confirmation of the bear trap.
There will be talk among the bears that Friday’s rally simply retested the May 8 breakout of the weekly chart trendline. However, I am a believer of the “where there is smoke there is fire” adage.
I think the burdens in the near term is upon the bears. This current rally, if not turned back hard next week, should work its way to the upper boundary of the descending triangle, or around $1,840.
There is one more chart I want to show. I believe the chart of Gold priced in Swiss Franc is a “tell.” This triangular coil could experience an upside breakout by closing above CHF1830. Such a development would create a target of CHF2130, although the prolonged nature of the coil would call this target into doubt. Anyway, it is something to keep watching.


No comments:
Post a Comment