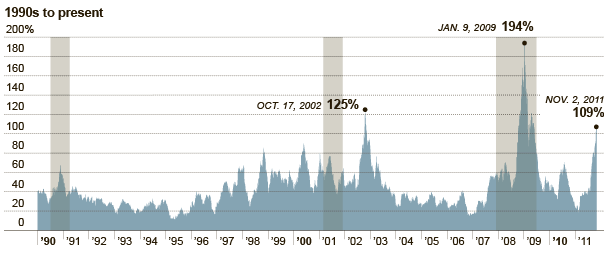
There were several violent swings of excess volatility during the Great Depression, but from 1940 through 1987 the figure never got as high as 100 percent. In early 1988, the excess volatility index peaked at 116 percent, largely because of the Oct. 19, 1987, crash, which caused a one-day drop of more than 20 percent in the index but proved to have little lasting economic impact.
The next time the index topped 100 percent was in late 2002, as the market was reaching its lows after the collapse of the technology stock bubble in 2000 and 2001. Then in 2008 and 2009, it climbed to new post-Depression peaks as share prices approached a low after the credit crisis led to a deep recession.
Much of the downward volatility of the last three months came on speculation that a new recession might be starting. Moves upward, meanwhile, came when economic optimism rose. The high level of excess volatility could signal that the economy’s recent slow growth is due to change — but it is not clear what that change might be.
No comments:
Post a Comment