There is a dominant cycle in gold prices lasting about 13-1/2 months, measured bottom to bottom. But the timing between major lows is not the only message that we can draw from this important cycle.
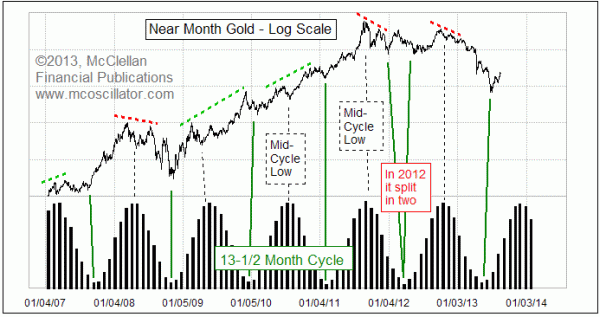
The latest instance of this cycle's major bottoms was ideally due in May 2013. It arrived a month late in June, but that is not outside the normal tolerance for punctuality. With the major cycle bottom evidently in, gold is now in the advancing phase of this cycle, which is when the most robust advances usually take place. So enjoy it.
Coming up sometime around November 2013, we can reasonably expect the next occurrence of a mid-cycle low, which tends to appear just as the sine wave representation is reaching its cycle top. In other words, this cycle is really a two-humped or "bactrian" cycle, with two important price highs occurring on either side of the top of the cycle itself. And within the construction of those two price highs, there exists a lot of information.
If the price action were a perfect sine wave, even with a double hump, then all tops and bottoms would be exactly equal to the others. But trends exist in the market. And those trends cause the twin price highs in each cycle to be unequal.
If the left-hand top is higher than the right-hand one, that is a condition known as "left-translation", and it conveys a bearish message for gold prices. When there is an instance of left-translation, the decline into the major cycle low nearly always exceeds the level of the mid-cycle low. The 2008 bottom was a perfect example of this.
But when the right-hand top is above the top which precedes the mid-cycle low, then that is called "right-translation", and it carries a bullish message for the future. It says that the decline into the major cycle low should not be as bad, and should not take out the price level of the mid-cycle low.
In the most recent cycle, the highest price high was before the mid-cycle low, another case of left-translation. And sure enough, the decline to the major cycle low was much worse than it has been other times.
But now we are into a new cycle, and into the most aggressive advancing phase of this cycle. Now is the period when the biggest advances in gold prices are usually seen. We can worry about whether the left peak is above the right peak for this cycle in a few months when that information arrives, but that is not the issue to worry about right now.
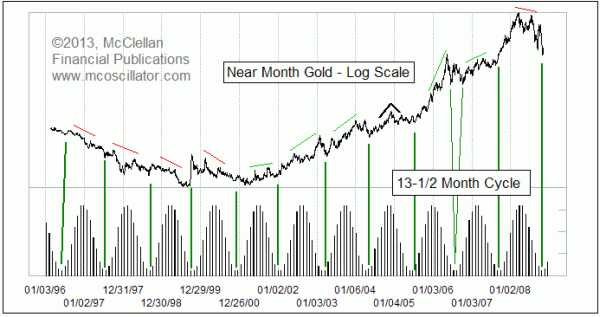
Why does this cycle exist? That is not a question for which I have a good answer. But I can say that it has been around for a really long time. Here is a long term flashback chart, showing how this cycle behaved between 1996 and 2008. And if this chart evidence is not enough to convince someone that there is a real phenomenon there, could that person ever be convinced by any amount of evidence?

You can see that all during the long bear market in gold during the late 1990s, there was left-translation each time. When an instance of right-translation finally appeared in 2001, that signaled a huge change in the nature of gold's price behavior.
I mentioned that I don’t know why gold exhibits this very regular 13-1/2 month cycle. But I do know that there is a very real and important anchor which seems to control its regularity. You may have noticed that these charts show a rather funny looking representation of a sine wave cycle, with bars instead of a wiggly line. Those bars have an important meaning: They represent the distance between the earth and moon on the day of the full moon. So the 13-1/2 month cycle which is evident in gold prices just happens to match up really well with the lunar apogee-perigee cycle. Or at least it has for a couple of decades, which ought to be long enough to establish it as a real phenomenon.
Why should that matter? I have no good explanation. But I learned long ago that worrying about the "why" does not get me very far. In the words of the late Mike Epstein, a NYSE floor trader who went on to become the president of the Market Technicians Association, and then an adjunct professor at MIT:
This is one of the most important points I've had to learn. For me, at least, "why" Is the most expensive and LEAST VALUABLE information. When you get "why" wrong (and act accordingly) you lose lots of money. You only can know "why" for sure after the fact (when it is useless). You gotta learn to live with the reality that there are (and the market knows) things that are beyond the individual(you)'s ken. The search for "why," whether right or wrong, can just as easily lead you to irrelevancies, or, worse yet, to valid data that will not impact on the market. The best analog is arguing with your wife. Being right is often totally valueless if not counterproductive.
So the point is that worrying about the "why" of gold's relationship with the moon's 13-1/2 month apogee-perigee cycle does not help. We have enough evidence now after multiple occurrences over a couple of decades to see that it does seem to matter. And even if we want to ignore the relationship to the moon, we can see that this 13-1/2 month cycle does produce robust rallies in the advancing phase, which is where we are right now.
Tom McClellanThe latest instance of this cycle's major bottoms was ideally due in May 2013. It arrived a month late in June, but that is not outside the normal tolerance for punctuality. With the major cycle bottom evidently in, gold is now in the advancing phase of this cycle, which is when the most robust advances usually take place. So enjoy it.
Coming up sometime around November 2013, we can reasonably expect the next occurrence of a mid-cycle low, which tends to appear just as the sine wave representation is reaching its cycle top. In other words, this cycle is really a two-humped or "bactrian" cycle, with two important price highs occurring on either side of the top of the cycle itself. And within the construction of those two price highs, there exists a lot of information.
If the price action were a perfect sine wave, even with a double hump, then all tops and bottoms would be exactly equal to the others. But trends exist in the market. And those trends cause the twin price highs in each cycle to be unequal.
If the left-hand top is higher than the right-hand one, that is a condition known as "left-translation", and it conveys a bearish message for gold prices. When there is an instance of left-translation, the decline into the major cycle low nearly always exceeds the level of the mid-cycle low. The 2008 bottom was a perfect example of this.
But when the right-hand top is above the top which precedes the mid-cycle low, then that is called "right-translation", and it carries a bullish message for the future. It says that the decline into the major cycle low should not be as bad, and should not take out the price level of the mid-cycle low.
In the most recent cycle, the highest price high was before the mid-cycle low, another case of left-translation. And sure enough, the decline to the major cycle low was much worse than it has been other times.
But now we are into a new cycle, and into the most aggressive advancing phase of this cycle. Now is the period when the biggest advances in gold prices are usually seen. We can worry about whether the left peak is above the right peak for this cycle in a few months when that information arrives, but that is not the issue to worry about right now.
Why does this cycle exist? That is not a question for which I have a good answer. But I can say that it has been around for a really long time. Here is a long term flashback chart, showing how this cycle behaved between 1996 and 2008. And if this chart evidence is not enough to convince someone that there is a real phenomenon there, could that person ever be convinced by any amount of evidence?

You can see that all during the long bear market in gold during the late 1990s, there was left-translation each time. When an instance of right-translation finally appeared in 2001, that signaled a huge change in the nature of gold's price behavior.
I mentioned that I don’t know why gold exhibits this very regular 13-1/2 month cycle. But I do know that there is a very real and important anchor which seems to control its regularity. You may have noticed that these charts show a rather funny looking representation of a sine wave cycle, with bars instead of a wiggly line. Those bars have an important meaning: They represent the distance between the earth and moon on the day of the full moon. So the 13-1/2 month cycle which is evident in gold prices just happens to match up really well with the lunar apogee-perigee cycle. Or at least it has for a couple of decades, which ought to be long enough to establish it as a real phenomenon.
Why should that matter? I have no good explanation. But I learned long ago that worrying about the "why" does not get me very far. In the words of the late Mike Epstein, a NYSE floor trader who went on to become the president of the Market Technicians Association, and then an adjunct professor at MIT:
This is one of the most important points I've had to learn. For me, at least, "why" Is the most expensive and LEAST VALUABLE information. When you get "why" wrong (and act accordingly) you lose lots of money. You only can know "why" for sure after the fact (when it is useless). You gotta learn to live with the reality that there are (and the market knows) things that are beyond the individual(you)'s ken. The search for "why," whether right or wrong, can just as easily lead you to irrelevancies, or, worse yet, to valid data that will not impact on the market. The best analog is arguing with your wife. Being right is often totally valueless if not counterproductive.
So the point is that worrying about the "why" of gold's relationship with the moon's 13-1/2 month apogee-perigee cycle does not help. We have enough evidence now after multiple occurrences over a couple of decades to see that it does seem to matter. And even if we want to ignore the relationship to the moon, we can see that this 13-1/2 month cycle does produce robust rallies in the advancing phase, which is where we are right now.
Editor, The McClellan Market Report
http://www.mcoscillator.com/learning_center/weekly_chart/golds_13-1_2_month_cycle/
No comments:
Post a Comment