Experienced traders recognize that volume typically dries up going into the holiday season. Light volume and the holiday seasonality generally push equity prices higher. The discussion of whether Santa Claus comes to Wall Street has arrived in earnest.
I do not envy Santa as he has the most arduous task of determining if Wall Street was naughty or nice. I suppose it depends on whether he reviews recent performance, or if past performance comes into play. Clearly coal will likely be found in a few stockings soon enough. If I were John Corzine, I would not expect to get a lump coal, but something far worse potentially.
In all seriousness, the bullishness has gotten pervasive in the media and economic data points such as unemployment and consumer credit have improved according to the government. One way to gauge investor sentiment is to look at the weekly advisor sentiment numbers courtesy of Bloomberg and Investor’s Intelligence.
According to this week’s advisor sentiment numbers, advisors who are bullish advanced to 47.4% from 44.2% last week. Bearish advisors dropped to 29.5% from 30.5% from the previous week. The 29.5% bearish data point matches a level that has not been seen in nearly 4 months. Bullishness has clearly become the leading expectation in the marketplace.
Only one asset has the opportunity to be “The Grinch” and ruin Christmas on Wall Street. If the U.S. Dollar rallies sharply, risk assets are certain to get hammered lower. In addition to the bullish tenor of market participants, most market pundits and gold bugs believe strongly that the U.S. Dollar is doomed fated for lower prices.
When I look at the long term momentum of a stock or commodity contract I will look at a monthly chart and plot the 12 month moving average against the price action. While it seems simple, equity and futures positions adhere to the 12 month moving average quite closely in many cases. The analysis is very simple as prices above the 12 month moving average equate to bullishness and prices below the moving average predict lower prices. The monthly chart of the Dollar Index futures is shown above.
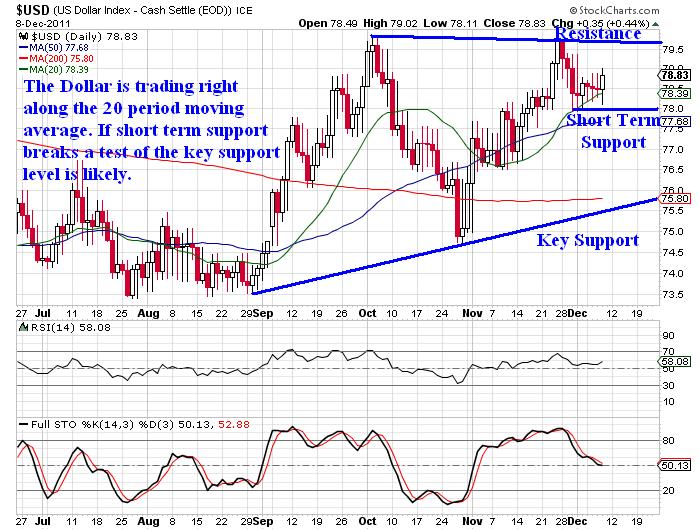
As can be seen above, the Dollar Index futures are showing strength currently. The 12 month moving average is starting to flatten out which is also a bullish indicator. When looking at the daily time frame we can see that price action is trading inside a wedge pattern and is bouncing higher off of support:
An additional catalyst that could push the U.S. Dollar higher is the economic tragedy that is Europe. European political leaders need to come up with a series of strong solutions that will stabilize their economic crisis otherwise the Euro will weaken further. A weakening or potentially crashing Euro will push buyers back into the U.S. Dollar. This would in turn place downward pressure on equities and commodities. . . .
Still long UUP here as a portfolio hedge. The weekly chart looks pretty good to me, although volume was a little anemic during that last rally attempt.

No comments:
Post a Comment