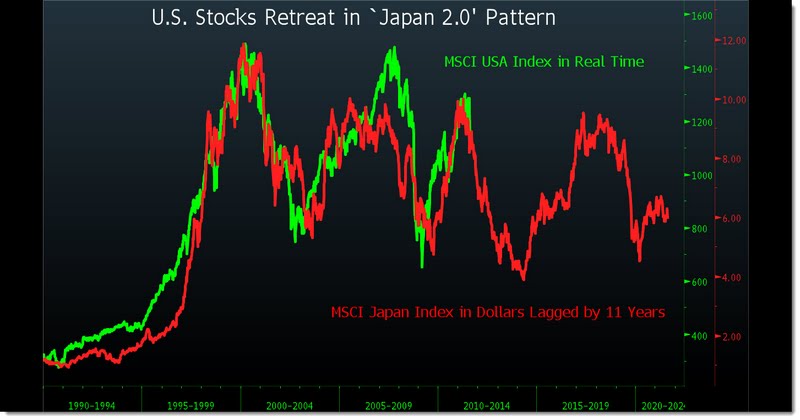
 This year’s tumble in U.S. stocks mirrors the Japanese selloff that began 11 years ago, an indication to hedge fund TTN AG that American equities may have further to fall.
The CHART OF THE DAY shows the pattern of gains and losses in the MSCI USA Index has followed the dollar-denominated MSCI Japan Index with an 11-year lag since 1990. While the U.S. gauge has retreated about 15 percent from this year’s high in April, the Japanese measure sank more than 50 percent during the slide that started in April 2000, data compiled by Bloomberg show.
There is a bounce in here, but my best guess is that there is more downside work to come.
Note: Where our Fed stepped up and flooded the system with liquidity, the Japanese central bank did not.Whether that means the US avoided a Japan like decade plus long recession, or merely delayed it, has yet to be determined . . .
http://www.ritholtz.com/blog/2011/08/turning-japanese-spx-vs-nikkei-index-10-year-lag-2/
No comments:
Post a Comment