One of the most valuable tools that we have as technicians is the ability to visualize price data in a variety of ways. Japanese Candlesticks tell a story about how a market behaved during any given period: a day, a week, month, 10-minutes, etc. The color of the candle, the size of the body, the length of the shadows (“wicks”), and the location of the candle along with its surroundings also factor into the story telling.
 Today I want to discuss long shadows, their implications, and what happens when they fail to confirm. You see, whenever we have a large candlestick dominated by a long shadow, we know that the bulls (or the bears) could not hold on to control for that given period.
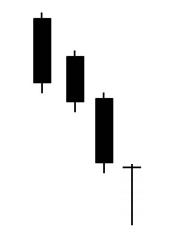
Let’s use an example of a long lower shadow after prices have been trending down. This tells us that the market opened near its highs and then sold off throughout this particular timeframe only to recover and close back at or near the highs. This is what it looks like:
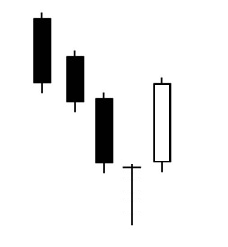
Whenever we see something like this, all of these bullish implications start to pop into our heads. The Japanese would call this fourth candlestick, the one with the long lower shadow, “a hammer”. They call it this because the candlestick suggests that the market is “hammering in a bottom”. For confirmation of this reversal, the next period should follow through with a hollow candle to the upside. The stronger the follow through, the more powerful the bullish signal:
The best part about these candlesticks is the fact that they present great entry points. The risk becomes well defined, because if it rolls over back below the low for that reversal period, all bets are off.
But today I just want to focus on what happens when these reversal candlesticks fail. These, to me, are some of the most powerful signals in the market. The long shadows are supposed to be important reversals. However, when these types of candles are taken out to the downside and that reversal fails to hold, the market is telling us there are larger forces at work. At this point we know the selling is so strong, that a short position or at least avoiding a long position is our best bet. Here is what that might look like:
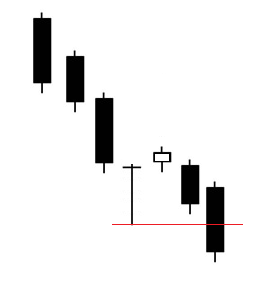
This is a very powerful sell signal. When the reversals fail, look out below.
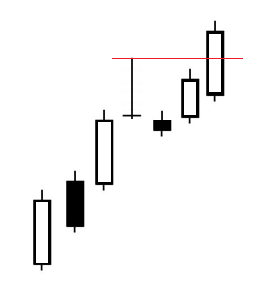
Now, remember that these scenarios can take place in both directions. Some of the most bullish signals are when a reversal candle with a long upper shadow (in an uptrend) gets taken out to the upside. It’s the same idea, just in the opposite direction:
In these examples, the reversal candles are immediately taken out after a couple of periods. In other cases, however, we could see some sideways action for 5-8 periods and then take out the reversal candlestick. There are many ways to use this particular signal. I’ve used it for many years and see it all the time. This is especially true in a trending market. Quite often we’ll get a reversal candle that then gets taken out confirming the bull (or bear) trend.
A good friend of mine told me recently that his technical analysis has improved tremendously since he added Japanese Candlesticks to his arsenal. Candles really do tell interesting stories, and I think it’s advantageous to use them regularly.
I don’t just use candles, I also look at line charts and bar charts for different reasons. I personally like to use line charts for ratios or if I’m just trying to clear out some of the noise. Bars are also great for cleaning up the charts in order to focus just on price. Too often we get so caught up in our moving averages and momentum indicators, that we forget about the only thing that actually matters: price. Candles are just another way to visualize that price data.
I’ve wanted to touch on this topic of failed long shadows for a while now but hadn’t gotten around to it. I hope this sparks a conversation about other potential patterns that can help us with our entry and exit points.
What do you guys think?
http://allstarcharts.com/long-shadows-fail/
No comments:
Post a Comment