PeterLBrandt, May 20th, 2013. Smells like SM to me.
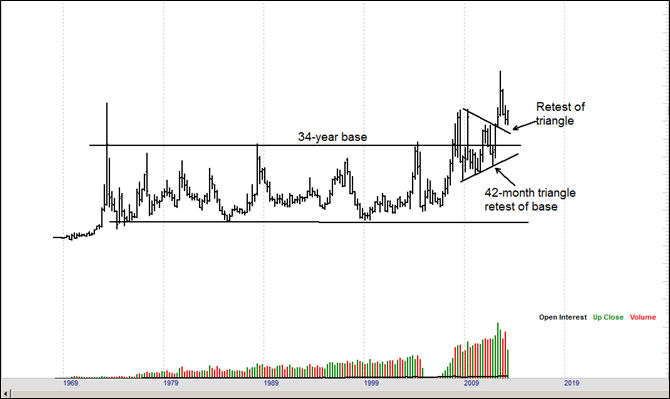
The quarterly chart shows that this market completed a 34-year base in 2008.
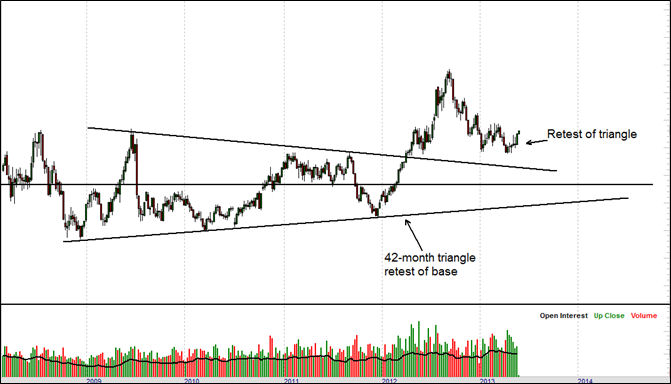
The weekly chart shows that the market formed a 42-month triangle that retested the massive 34-year base. This triangle was completed in 2012.
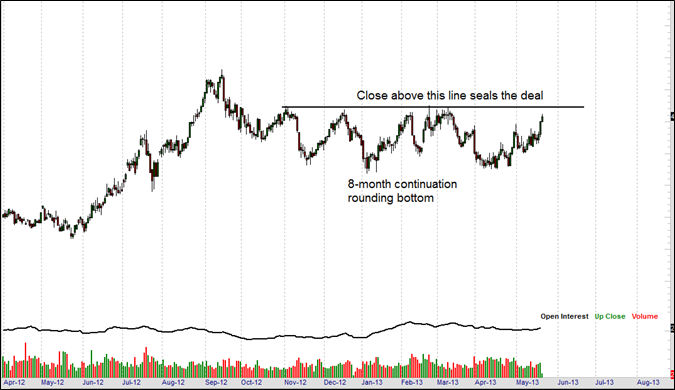
The decline since September 2012 has served as a retest of the completed triangle. The daily chart displays a possible 8-month continuation rounding bottom pattern. A decisive close above noted upper boundary of this pattern would set the stage for a magnificent bull trend. The target of this market set up would be a move equal to $17,000 per futures contract.
But it is up to you to figure out what the market is.
Once every few years a market sets up whereby the fundamentals harmonize with the longest-term chart, which harmonizes with the weekly chart, which harmonizes with the daily chart.The quarterly chart shows that this market completed a 34-year base in 2008.
The weekly chart shows that the market formed a 42-month triangle that retested the massive 34-year base. This triangle was completed in 2012.
The decline since September 2012 has served as a retest of the completed triangle. The daily chart displays a possible 8-month continuation rounding bottom pattern. A decisive close above noted upper boundary of this pattern would set the stage for a magnificent bull trend. The target of this market set up would be a move equal to $17,000 per futures contract.
No comments:
Post a Comment