April 30, 2013 by Andrew Thrasher.
Not to take away from Thrasher's interesting and valid chart analysis, but it should be pointed out DBA could be misleading as a tell for agricultural commodities. While corn does indeed account for 12% of DBA, and other major food commodities such as sugar, wheat, and soybeans are also well represented, livestock futures (live cattle and feeder cattle as well as lean hogs) account for 25% of the ETF. Not everyone may want to invest in livestock for ethical or esthetic reasons, and those who don't care should note this carefully: livestock prices are often negatively correlated to grain prices because the animals are consumers of grain. CORN is available as a pure play on its namesake.
The agriculture industry has been taken some hits in 2013, down over 6% YTD and almost 15% from its high last September. There was an expectation that this would be a big crop year for corn, with the USDA estimating that this year would see the highest corn acreage since 1936. Well it’s been a wet Spring for much of the Midwest, with reports of flooding in certain areas. This has pushed back planting of many crops, although there is still a few weeks left to get seed in the ground. Traders seem to be ignoring the weather reports and have pushed agg prices lower.
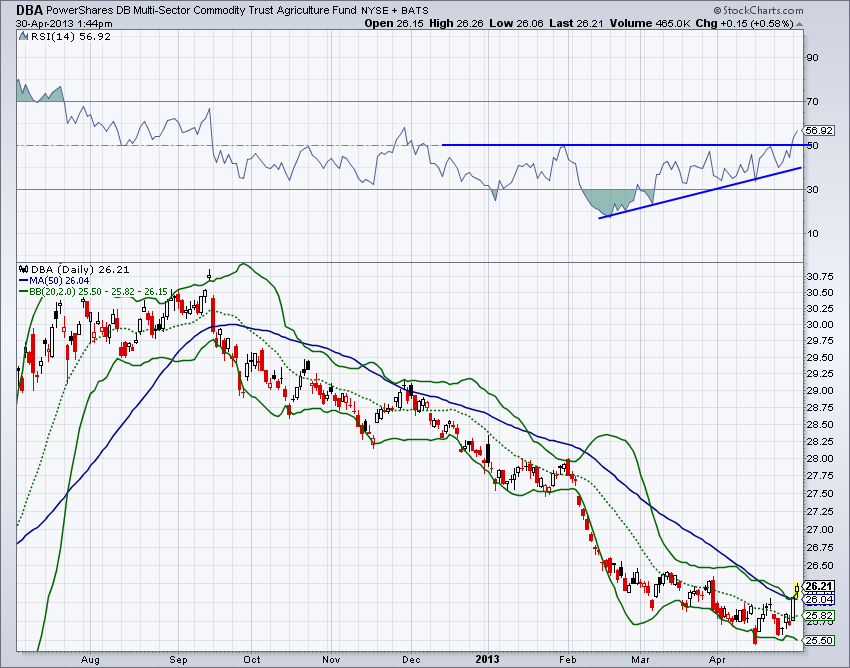
Today we are going to look at the PowerShares Multi-Sector Commodity Agriculture ETF ($DBA). Momentum, based on the RSI indicator, has been diverging from price since mid-February as it puts in higher lows. While $DBA has been hitting lower lows, the Relative Strength Index has been able to exit oversold territory and make an attempt at breaking above 50. As I’ve discussed in previous posts, when RSI is unable to break above the bearish range that has resistance around 50-60, we can extrapolate that bulls are holding weak hands. We saw a test of 50 in late January and again earlier this month before we finally broken above.
The 50-day Moving Average has been acting as resistance since the peak in September. Over the last two days price has been able to break above the moving average, following momentum’s led higher. However, with the last couple days of strength $DBA has broken above its upper Bollinger Band. It would be healthy for price to take a breather over the next day or two as the Bollinger Bands expand, however this doesn’t mean pricecan’t advance without some type of consolidation.
 Looking at the COT data, we see that commercial traders, the ‘smart money’ now has a net-long position in corn, which accounts for 12% of $DBA. Commercial traders haven’t had a net-long position since June of last year – right before corn jumped from $6 to $8. We also saw commercial traders take a net-long position as corn prices bottomed in 2010 and rose 100% over the next 12 months. Typically we see these traders holding net-short positions as a hedge to other positions or crop production, so when a shift is made to net-long, a large change in price is likely. Corn has reacted positively to this bullish COT data, rising 5% in the last two days.
The weather over the next few weeks will likely have a large impact on the future of crop prices and how much progress farmers across the country are able to make. But based on the chart of the agriculture ETF and corn, things seem posed for appreciation. I’ll be watching to see if $DBA can hold its 50-MA, if momentum can put in a floor around 50, and if the ‘smart money’ makes continues to take on more long positions in the agg space.
Not to take away from Thrasher's interesting and valid chart analysis, but it should be pointed out DBA could be misleading as a tell for agricultural commodities. While corn does indeed account for 12% of DBA, and other major food commodities such as sugar, wheat, and soybeans are also well represented, livestock futures (live cattle and feeder cattle as well as lean hogs) account for 25% of the ETF. Not everyone may want to invest in livestock for ethical or esthetic reasons, and those who don't care should note this carefully: livestock prices are often negatively correlated to grain prices because the animals are consumers of grain. CORN is available as a pure play on its namesake.
The agriculture industry has been taken some hits in 2013, down over 6% YTD and almost 15% from its high last September. There was an expectation that this would be a big crop year for corn, with the USDA estimating that this year would see the highest corn acreage since 1936. Well it’s been a wet Spring for much of the Midwest, with reports of flooding in certain areas. This has pushed back planting of many crops, although there is still a few weeks left to get seed in the ground. Traders seem to be ignoring the weather reports and have pushed agg prices lower.
Today we are going to look at the PowerShares Multi-Sector Commodity Agriculture ETF ($DBA). Momentum, based on the RSI indicator, has been diverging from price since mid-February as it puts in higher lows. While $DBA has been hitting lower lows, the Relative Strength Index has been able to exit oversold territory and make an attempt at breaking above 50. As I’ve discussed in previous posts, when RSI is unable to break above the bearish range that has resistance around 50-60, we can extrapolate that bulls are holding weak hands. We saw a test of 50 in late January and again earlier this month before we finally broken above.
The 50-day Moving Average has been acting as resistance since the peak in September. Over the last two days price has been able to break above the moving average, following momentum’s led higher. However, with the last couple days of strength $DBA has broken above its upper Bollinger Band. It would be healthy for price to take a breather over the next day or two as the Bollinger Bands expand, however this doesn’t mean pricecan’t advance without some type of consolidation.
Looking at the COT data, we see that commercial traders, the ‘smart money’ now has a net-long position in corn, which accounts for 12% of $DBA. Commercial traders haven’t had a net-long position since June of last year – right before corn jumped from $6 to $8. We also saw commercial traders take a net-long position as corn prices bottomed in 2010 and rose 100% over the next 12 months. Typically we see these traders holding net-short positions as a hedge to other positions or crop production, so when a shift is made to net-long, a large change in price is likely. Corn has reacted positively to this bullish COT data, rising 5% in the last two days.The weather over the next few weeks will likely have a large impact on the future of crop prices and how much progress farmers across the country are able to make. But based on the chart of the agriculture ETF and corn, things seem posed for appreciation. I’ll be watching to see if $DBA can hold its 50-MA, if momentum can put in a floor around 50, and if the ‘smart money’ makes continues to take on more long positions in the agg space.
No comments:
Post a Comment