JC Parets, All Star Charts, April 9th, 2013. I love the way these guys do most of my work for me every day.... And already this morning, the utilities ETF, XLU, has posted yet another new high.
Today I wanted to share something that I think is crucial to understanding this market. Who is driving it and who is holding it back? I look at these charts every day but don’t share them collectively as often as I probably should. What we’re looking at here are the S&P Sector ETFs using daily bars to clear out any of the other noise. I drew some lines representing the last 4 weeks or so to show who has been doing well, and who hasn’t.
The first one we’ll start with is Financials. Lower highs and lower lows for these guys since mid-March, but within a well-defined downtrend channel:

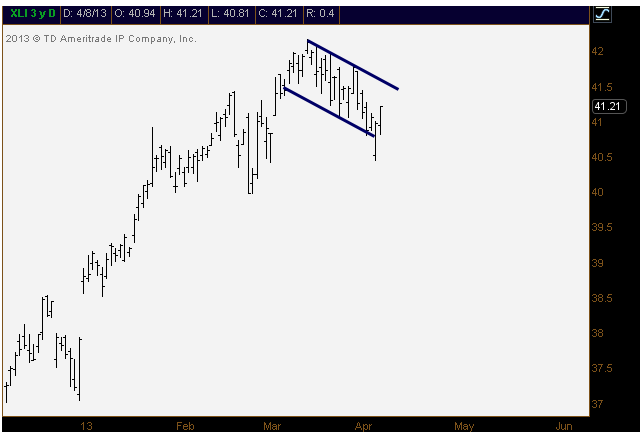
Industrials have been in a similar looking downtrend:
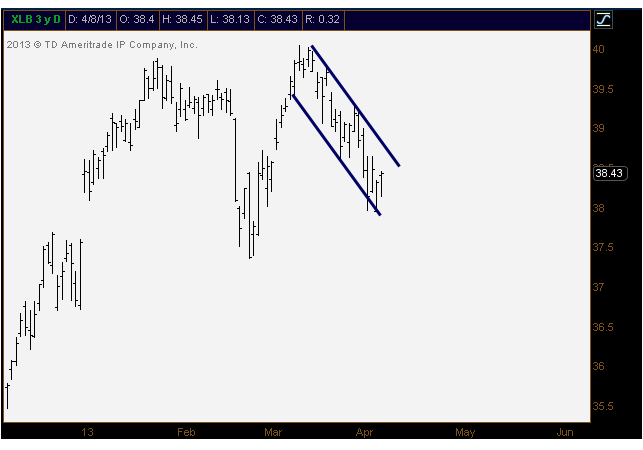
And the worst of this downtrending group has to be Materials:
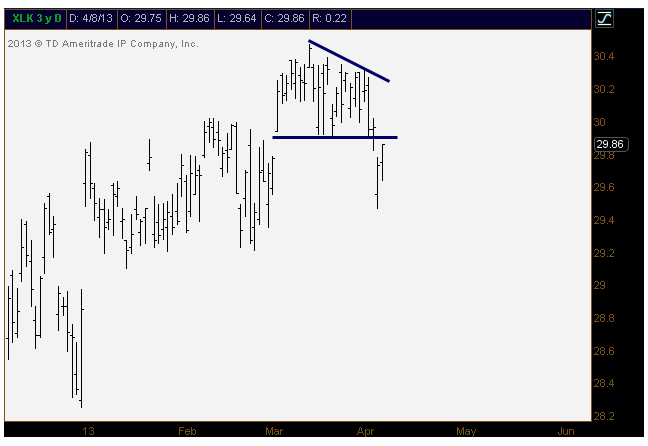
Although tech hasn’t looked so hot either taking out some key support recently:
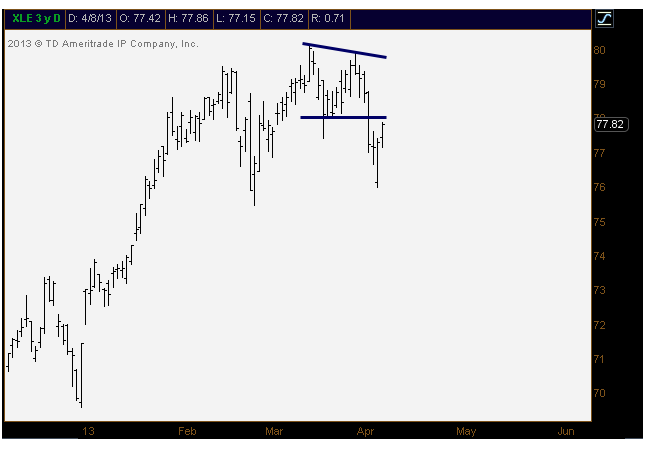
Energy looks similar to Tech:
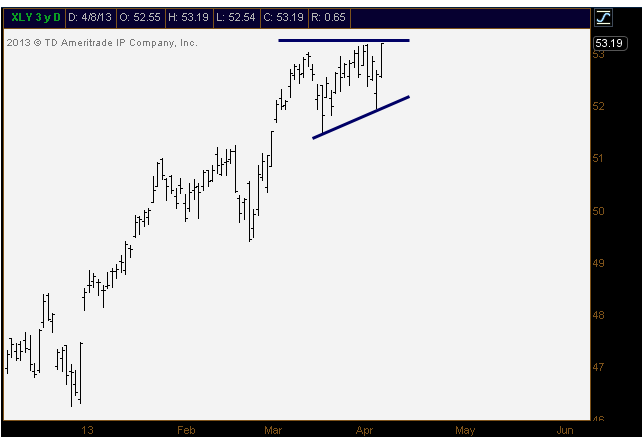
The Consumer looks much better. Here are Discretionaries:
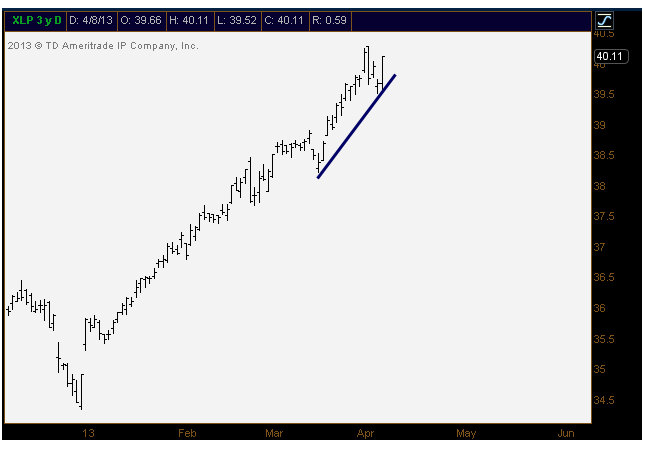
But who are the big winners? Staples:
Healthcare:

Utilities:

These historically more defensive groups are ripping to new highs. These sectors are the reason that US Stock Market Averages are anywhere near highs. A lof the components of the market aren’t participating. I speak to all different kinds of investors every day and a common theme I’m hearing is that their portfolios are underperforming the broad averages. They read that US Stocks are making all-time highs, so they look at their portfolios and wonder why theirs are not at new highs, and haven’t been for months. My explanation to them is that, in reality, the “market of stocks” peaked in January. So unless your “portfolio” is the SPX Index you’re not performing as well as that average.
We’re in a current market environment that is being driven by just a few sectors. The majority of the others have been drifting lower for 4 weeks. So as participants that own stocks, not the SPX Index, we need to recognize where the strength is coming from. If you trade E-mini contracts or just trade $SPY all day, then this doesn’t affect you. But most people are in individual names or spaces.
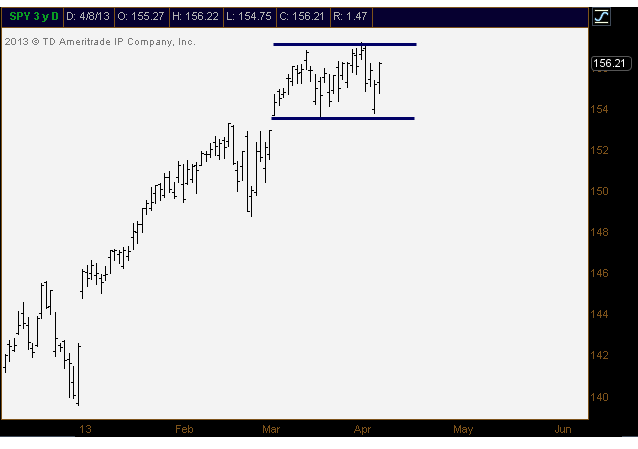
And even when you look at the index itself, the S&P500 has really been trading sideways for 4 weeks. It hasn’t gone anywhere while it’s been in this Christmas light formation of up day/down day/up day/down day for what I understand is a record amount of days.
So careful what you read in the headlines about all-time highs. There are weak sectors within the market, and there are some really strong ones. The bulls want to see some rotation out of the defensives and into the sectors that have been struggling if this market is going to keep grinding higher. The bears want to see follow through from the struggling ones and have the leaders play catch-up to the downside.
I find that it’s a helpful exercise to look at the components of the market and see how they’re faring against each other and also against the broader average. I guess we’ll see how this develops.
Today I wanted to share something that I think is crucial to understanding this market. Who is driving it and who is holding it back? I look at these charts every day but don’t share them collectively as often as I probably should. What we’re looking at here are the S&P Sector ETFs using daily bars to clear out any of the other noise. I drew some lines representing the last 4 weeks or so to show who has been doing well, and who hasn’t.
The first one we’ll start with is Financials. Lower highs and lower lows for these guys since mid-March, but within a well-defined downtrend channel:
Industrials have been in a similar looking downtrend:
And the worst of this downtrending group has to be Materials:
Although tech hasn’t looked so hot either taking out some key support recently:
Energy looks similar to Tech:
The Consumer looks much better. Here are Discretionaries:
But who are the big winners? Staples:
Healthcare:
Utilities:
These historically more defensive groups are ripping to new highs. These sectors are the reason that US Stock Market Averages are anywhere near highs. A lof the components of the market aren’t participating. I speak to all different kinds of investors every day and a common theme I’m hearing is that their portfolios are underperforming the broad averages. They read that US Stocks are making all-time highs, so they look at their portfolios and wonder why theirs are not at new highs, and haven’t been for months. My explanation to them is that, in reality, the “market of stocks” peaked in January. So unless your “portfolio” is the SPX Index you’re not performing as well as that average.
We’re in a current market environment that is being driven by just a few sectors. The majority of the others have been drifting lower for 4 weeks. So as participants that own stocks, not the SPX Index, we need to recognize where the strength is coming from. If you trade E-mini contracts or just trade $SPY all day, then this doesn’t affect you. But most people are in individual names or spaces.
And even when you look at the index itself, the S&P500 has really been trading sideways for 4 weeks. It hasn’t gone anywhere while it’s been in this Christmas light formation of up day/down day/up day/down day for what I understand is a record amount of days.
So careful what you read in the headlines about all-time highs. There are weak sectors within the market, and there are some really strong ones. The bulls want to see some rotation out of the defensives and into the sectors that have been struggling if this market is going to keep grinding higher. The bears want to see follow through from the struggling ones and have the leaders play catch-up to the downside.
I find that it’s a helpful exercise to look at the components of the market and see how they’re faring against each other and also against the broader average. I guess we’ll see how this develops.
No comments:
Post a Comment