The Big Picture, March 14th, 2013
Another year or more of gains may lie ahead for U.S. stocks if history is any guide, according to Jeffrey Kleintop, LPL Financial Corp.’s chief market strategist.
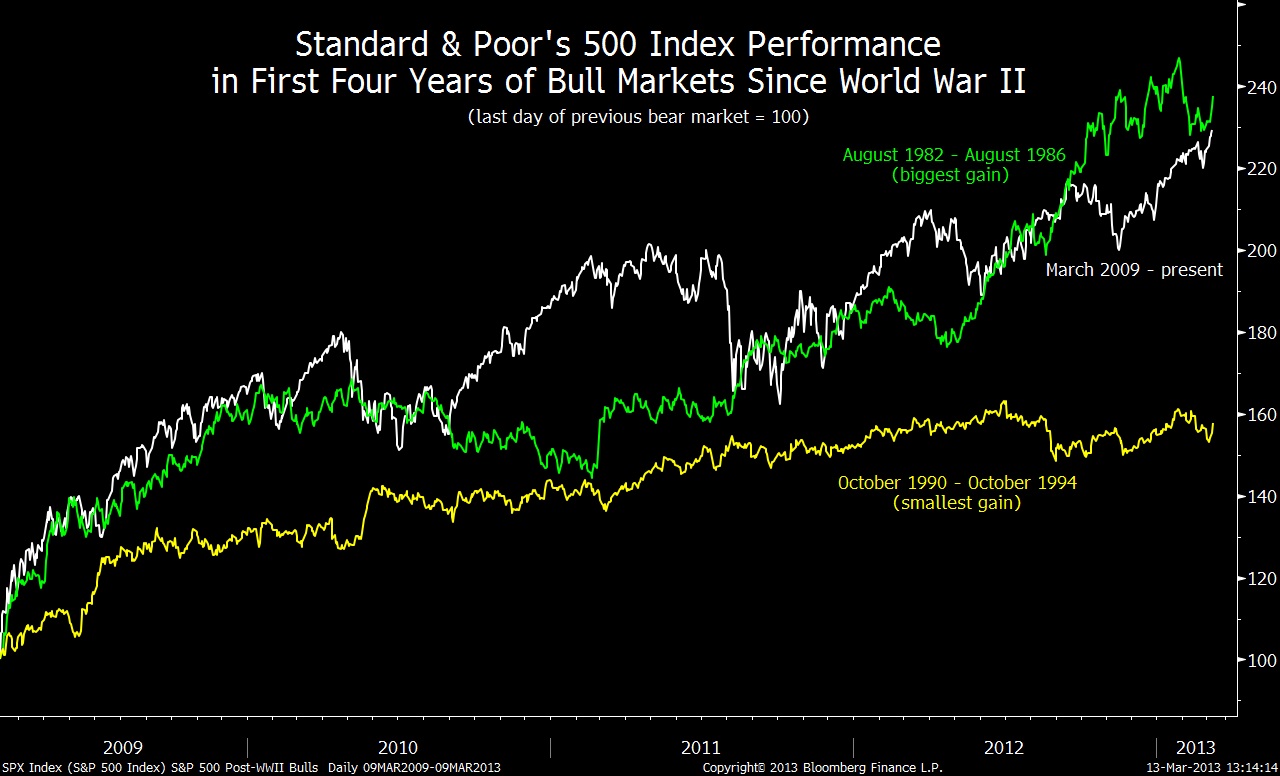
The bull market that began in March 2009 is the seventh to last at least four years since World War II, as Kleintop wrote two days ago in a report. Four of the previous rallies ran for five years or more, and the fifth year produced a 22 percent average gain for the Standard & Poor’s 500 Index.
As the CHART OF THE DAY shows, the S&P 500’s ascent has been relatively steep. In the bull market’s first four years, the index rose 129 percent, the second-best performance of the postwar period. The chart depicts the biggest four-year gain, a 138 percent surge that started in August 1982, as well as the smallest, a 58 percent gain beginning in October 1990.
“The current bull market is not likely to be over,” Kleintop wrote. Even so, the Boston-based strategist added that the S&P 500 may be overdue for a drop of 5 percent or more. The index hasn’t fallen that far since a two-month slide ending Nov. 15, and the almost four-month interval is the third-longest since the advance began.
“Pullbacks do not have to be viewed as wicked,” the report said. “Instead, we should cheer them, since they help to sustain the bull market and provide opportunities for investors to put money to work at a discount.”
The S&P 500 has yet to retreat for more than two days in a row this year. Yesterday’s decline of 0.2 percent followed seven consecutive days of gains, which left the index 0.6 percent from a record set on Oct. 9, 2007.
Source:
Bloomberg
Chart of the Day, March 13
David Wilson
Bloomberg
Chart of the Day, March 13
David Wilson

No comments:
Post a Comment