Joshua M Brown, The Reformed Broker, March 27th, 2013
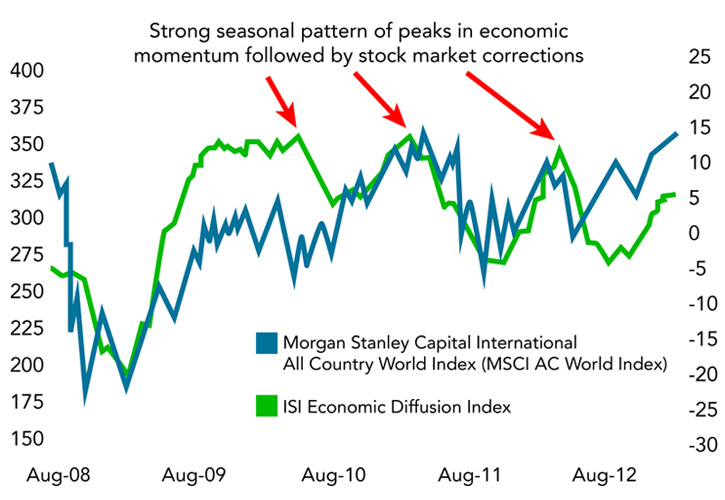
Every year so far, post-Credit Crisis, we've played the same game this time of year - economic momentum slows down, fears from Europe resume and the US stock market takes a nasty tumble.
In 2010, 2011 and 2012, the US stock market peaked during one of the four weeks of April. A correction of between 10 and 19% ensued.
The number one question on everyone's mind right now (ours included) is whether or not this spring will be yet another Risk Off Extravaganza.
Here's Jurrien Timmer, co-manager of the Fidelity Global Strategies Fund with his new chart on the topic:
- In 2010 it was the end of QE1 and the beginning of the eurozone debt crisis that led to a 17% correction in the S&P 500 from the April high to the July low (based on intraday extremes).
- In 2011 it started as an inflation shock (in terms of food and energy prices) caused by the combination of QE2 and an overheating China, which was ultimately compounded by the debt ceiling fiasco, policy tightening in China, and a further unraveling of the debt crisis in Europe. The market peaked in May and fell 21% until it bottomed in early October.
- In 2012 it was the growth recession in China combined with yet another flareup in Europe, this time brought on by the Greek elections. The S&P 500 peaked in April and fell 11% to its low in June.

No comments:
Post a Comment