Written by Tom McClellan, McClellan Financial, Feb. 1, 2013.

February 01, 2013
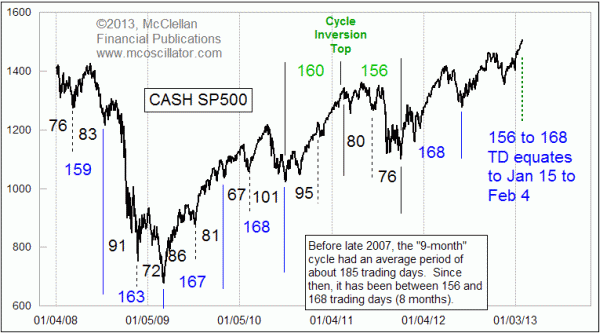
One of the most important market cycles that we have tracked over the years has been the 9-month cycle, which is sometimes also referred to as the 40-week cycle. During the 1980s and 1990s, it had a fairly reliable period of about 185 trading days.


One of the most important market cycles that we have tracked over the years has been the 9-month cycle, which is sometimes also referred to as the 40-week cycle. During the 1980s and 1990s, it had a fairly reliable period of about 185 trading days.
That period suddenly changed in 2007, and since then it has been running at between 156 and 168 trading days, or about 8 months. I do not have a good explanation for why that change would occur, just as I don't have a good explanation for why a 9-month cycle would have existed in the first place.
My assumption has always been that it was a "natural" cycle, meaning that it was tuned to some harmonic frequency of how the human mind works, especially in a crowd phenomenon like the stock market. This would be differentiated from man-made cycles such as the 4-year Presidential Cycle which is tied to the U.S. election frequency. If there were a 3-month cycle, then we could conclude it was somehow tied to quarterly earnings or quarterly tax deposits.
I never came up with a good explanation for some man-made cause for a 9-month cycle, which is why I thought that it was something "natural" to the market. Having studied the theory of vibrations of mechanical structures years ago, I understood that every solid body has a natural frequency at which it vibrates. If you take a yard-stick and hold one end on the edge of your desk, then you can give the free end a bump and then see and hear the "thwang" of it vibrating at its natural frequency. If you shorten or lengthen the portion of it that is sticking out into the air, you can change that natural frequency.
Similarly, in a fluid medium like water or motor oil, there are waves that travel at a natural frequency for that medium. So if you had an experimental wave pool and substituted motor oil for water, you would see a change in the natural frequency of how waves travel. Changing the viscosity of the fluid makes for a change in natural frequency.
If we take that same principle and apply it to the fluid medium of the financial markets, then by observing that a cycle has changed its period in a meaningful way, then we can conclude that the "viscosity of money" must have changed in some way. What that change might have been is a different question. This change in period from 9 months down to 8 months began in 2007, which just happens to be when the SEC eliminated the "uptick rule" for shorting stocks. It is hard to see how that might have changed the viscosity of money. Other changes have been under way for years, such as the shift to decimalization which started back in 2000, and the change to 3-day stock settlements instead of 5 which started in 2004.
Interestingly, the 9-month cycle period survived both of those changes, and lasted until 2007. If those structural changes were really responsible for changing the viscosity of money and thus changing the cycle period, then I would think they should have mattered right away.
Whatever the explanation, we have enough evidence now in the 5+ years since the change in period to say that the old 9-month or 185 trading day period is no longer operative. And for the first few years of the new period, a couple of other attributes of the old 9-month cycle also survived with the new period.
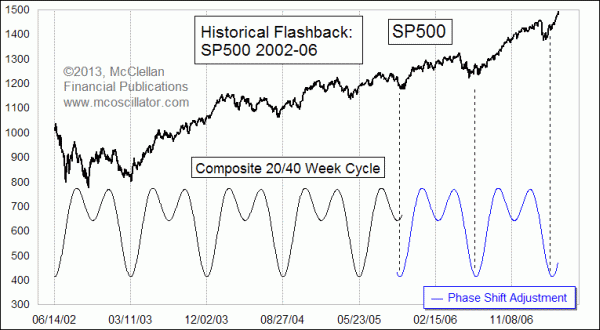
The first of those attributes is to have a mid-period bottom about halfway between the major cycle lows. Here is a chart from 1996-1999 which illustrates this pretty well:

The mid-cycle lows tended to be not as significant as the big end of cycle lows, but still noticeable. We can see evidence in the main chart above that this tendency has continued, at least up until recently.
The other attribute of the old 9-month cycle which survived for a while was that this cycle did not invert. Other cycles in the market can sometimes invert, which is when a top appears instead of a bottom at the end of the cycle. In studying decades of examples of 9-month cycle lows, I could not find a single instance of a genuine inversion. Instead, the 9-month cycle had an interesting personality quirk, which was that about every 6-8 years, it would undergo a "phase shift", where it stopped beating on the old schedule and started up again on some new one. Here is an example of that behavior:

What is happening to the market right now does not seem to fit the old model at all. We have already seen one true cycle inversion top back in early 2011, and as of right now (Feb. 1, 2013) it appears that another inversion is arriving. 2011 also saw the last of the real mid-cycle lows, with the last two major cycles not seeing a proper looking mid-cycle low. Maybe we are in the middle of a newfangled phase-shift event, or maybe some other explanation will be found for this different behavior we are observing.
Other than noting that a market top appears to be arriving now at the projected end of the current cycle, my point in bringing all of this up is that once-trusted market phenomena can change. The 9-month cycle had a great track record for decades of working in fairly predictable ways, but it is not working in those ways any more. Maybe it will come back, but probably not. So anyone who looks at market history to develop an hypothesis about what the "rules of physics" are for the market needs to understand that those rules can change. My observation has also been that such rules are most likely to change at the moment when one decides to count on them most to continue working.
No comments:
Post a Comment