With the recent sell-offs in US Markets, let’s keep in mind that some other areas of the world have been doing just that for over a month now. It started with Europe and some of the emerging markets the day after the Super Bowl. And since then, some of the economically sensitive commodities have joined in. Most importantly, in my opinion, is what we’re seeing from Copper – one of my favorite tells out there.
Here is a weekly chart of Copper Futures. The highs in the chart came back in February of 2011, just a couple of months before US Stocks peaked and lost over 20% over the next two quarters. Copper continued its decline along with Stocks and they both bottomed out together that October.
Since then, US Stocks have gone on to hit higher highs, and even all-time highs in some cases like the Small-caps, Mid-caps and Dow Transports. Copper, on the other hand, has not. In fact, as you can see in this weekly bar chart, the base metal has actually been stuck within this smaller symmetrical triangle that developed towards the bottom end of a much larger consolidation.
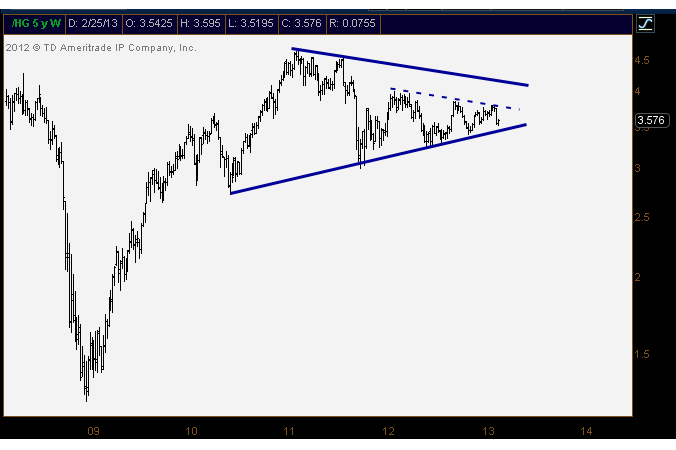
I think Copper here is a good tell here. We’ve been seeing some weakness unfold, no question, but this one could either foreshadow a more precipitous decline in risk assets, or hang on to that key multi-year trendline support and offer more of a “stay long” signal.
The bad news here is that Copper is currently attempting to hold on to this uptrend line from the June 2010 lows for what is now the 6th time. Unfortunately, the more times that a level is tested, the higher the likelihood that it breaks.
We can’t forget about this one – Dr. Copper knows.
No comments:
Post a Comment