Caution: I am a trader, not an analyst. My going in assumption on every trade is that I will be wrong and take a loss.
The charts would suggest that this week’s rally in stocks will soon run its course — that the next 70 point move in the S&P 500 index will be down, not up.
Several chart observations are worthy of note:
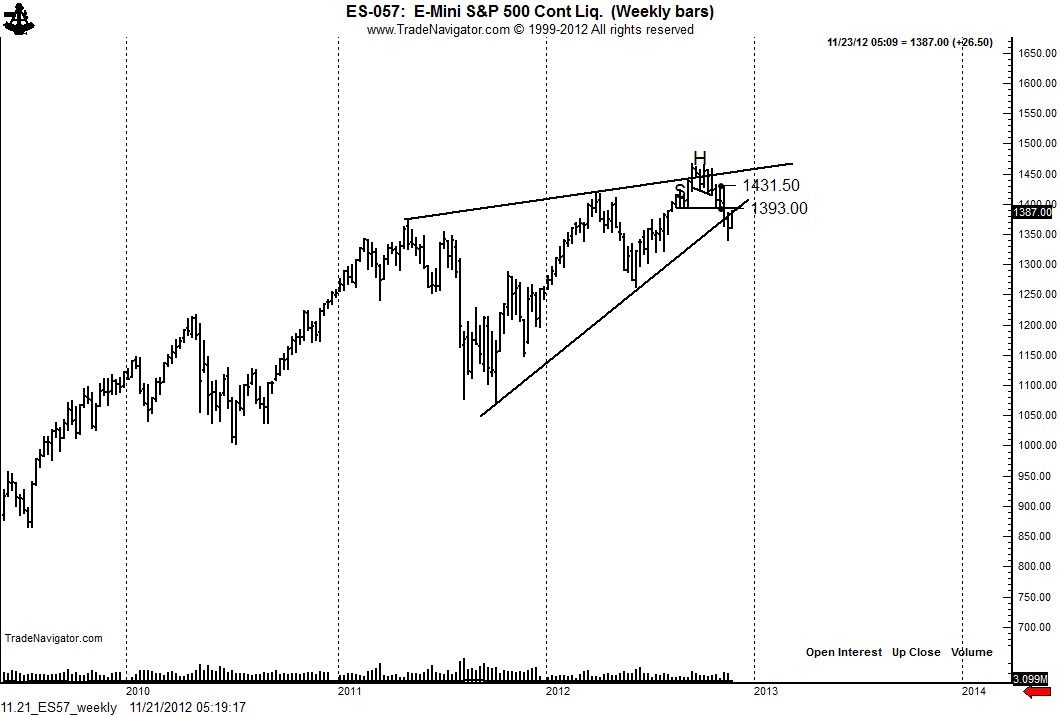
The weekly chart exhibits a possible 18-month rising wedge. (Note: Patterns are only confirmed once their targets are reached. Until then a chart pattern is only speculation. Guess what? Speculation is what traders do!) Note that the market ran past the upper boundary of the wedge (possible wedge) in September in a movement we chartists refer to as a “last-gasp throw over.”
The decline in earlier November completed this wedge (possible wedge). If this wedge interpretation is correct the lower boundary line should now offer resistance. The lower boundary comes into play at 1398 to 1404. The dashed line is drawn off the daily closes, not the intra day lows.
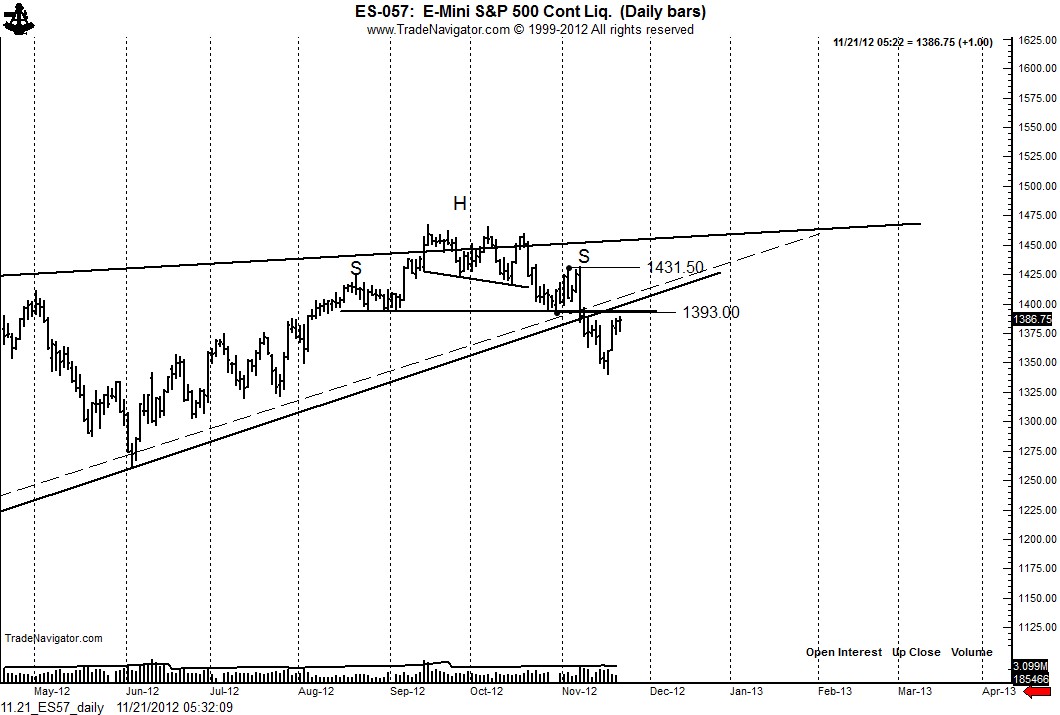
The daily graph shows that the decline on October 7 completed a 12-week H&S top. The neckline of this top is at 1393 (nearby futures).
Thus, a retest of the neckline and wedge boundary line would occur at 1393 to 1404. I expect this rally to be turned back in this area. The targets of the weekly wedge pattern remain unmet at 1253 and 1085, although I think the lower target may be a dream of the “doomsayers.”
Having exited recent shorts in both the S&Ps and Dow, I am interested in shorting this rally. By the way, a close above 1415 makes me question the bearish interpretation. A close above 1431 would lean me bullish on the charts.


No comments:
Post a Comment