The Fed decision was the catalyst for the final breakdown in precious metals. On Thursday Gold closed at a new low, below $1200 and the gold shares also closed at a new low. Last week we wrote:“The bulk of the evidence leads me to believe that we probably have not seen the bottom though we are very close…..Bottoms can happen in an instant or develop through a basing process. Huge immediate rebounds originate from extreme oversold conditions. We don’t have that at the moment.”
The bad news is obvious. Precious metals are breaking again. However, the good news is this will lead to the end of the bear market and a “back up the truck” or “fat pitch” type of buying opportunity. History makes a strong case that this bear market is about to end. Couple that with precious metals touching multi-year support levels and the bear market has a very high probability of ending.
First, we’ll look at Gold. The chart below shows all of Gold’s bear markets though we excluded the two extremes: the 1980-1982 (a 65% decline) and the 1987-1993 bear (lasted five years and only declined 35%). The current bear best resembles the bears of 1976-1976 and 1983-1985. The fact that the current bear is longer suggests it will be less severe in price. Gold’s shorter bears (including 1980-1982) ended in a panic selloff. It appears this bear will share the fate.
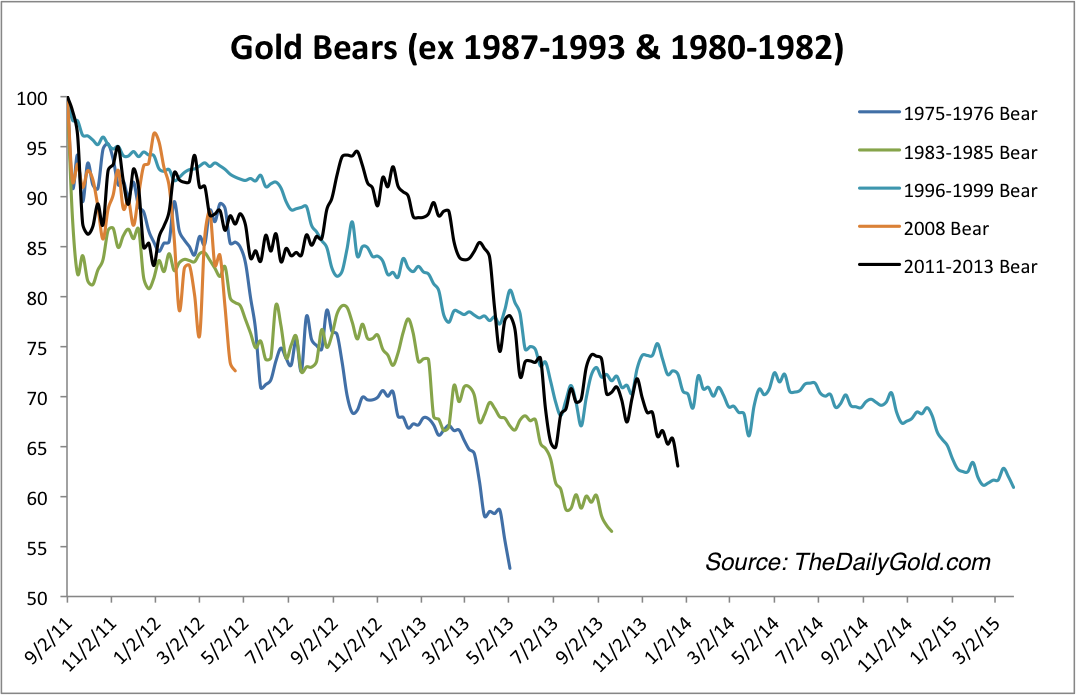
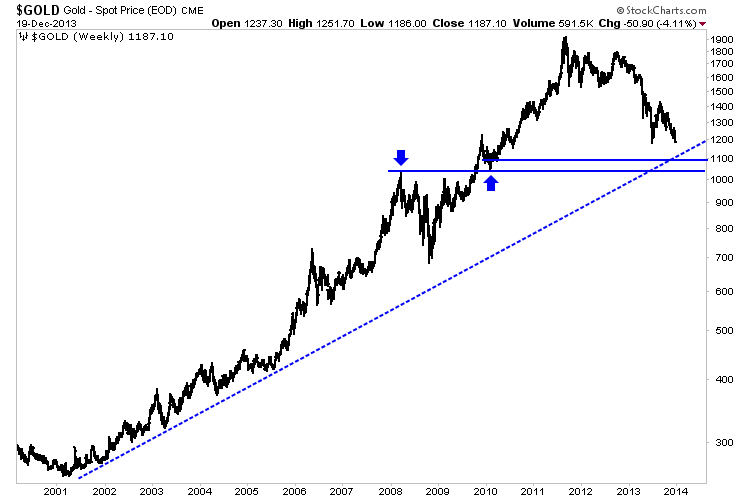
Where would a panic selloff take Gold? Gold should find strong support at $1085 which is the 50% retracement of the entire bull market. That is a 9% decline from Thursday’s close. Also, major trendline support comes into play in the low $1100s.
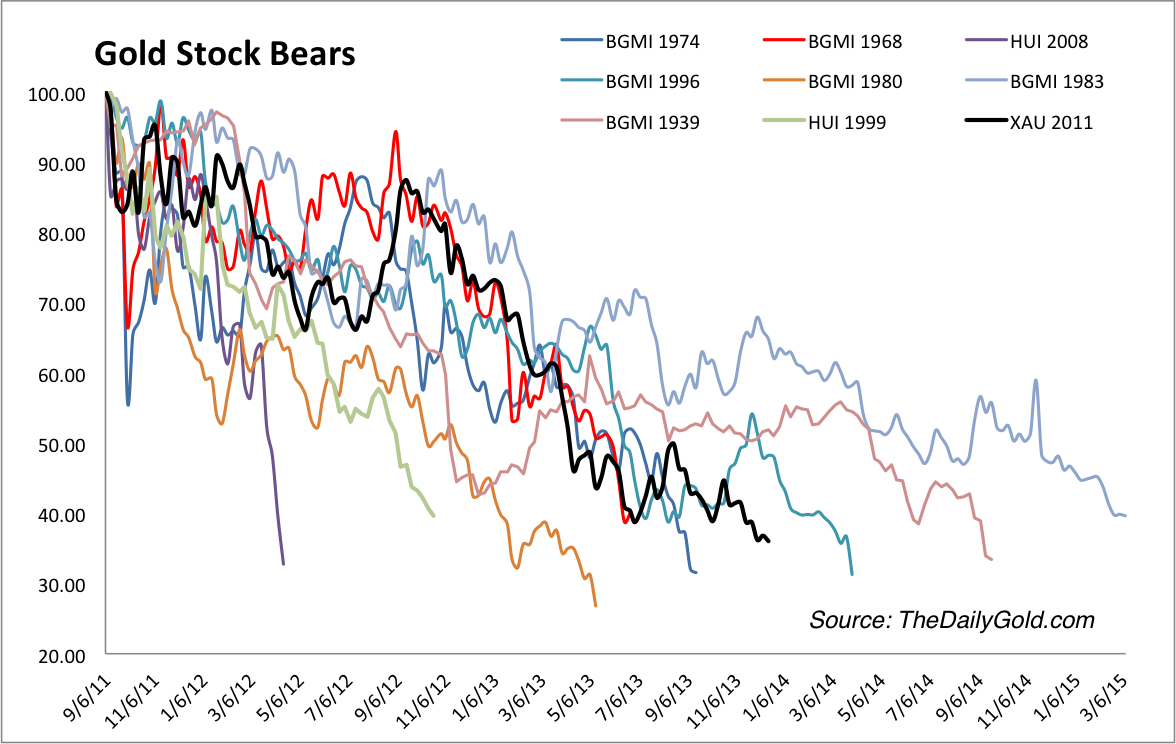
Moving to the gold stocks, we can see that the current bear market (in black) only needs to go a bit further to be on par with past bear markets. Note that the three bear markets that lasted the longest were far less oversold at the current point. This suggests the current bear should end quite soon.
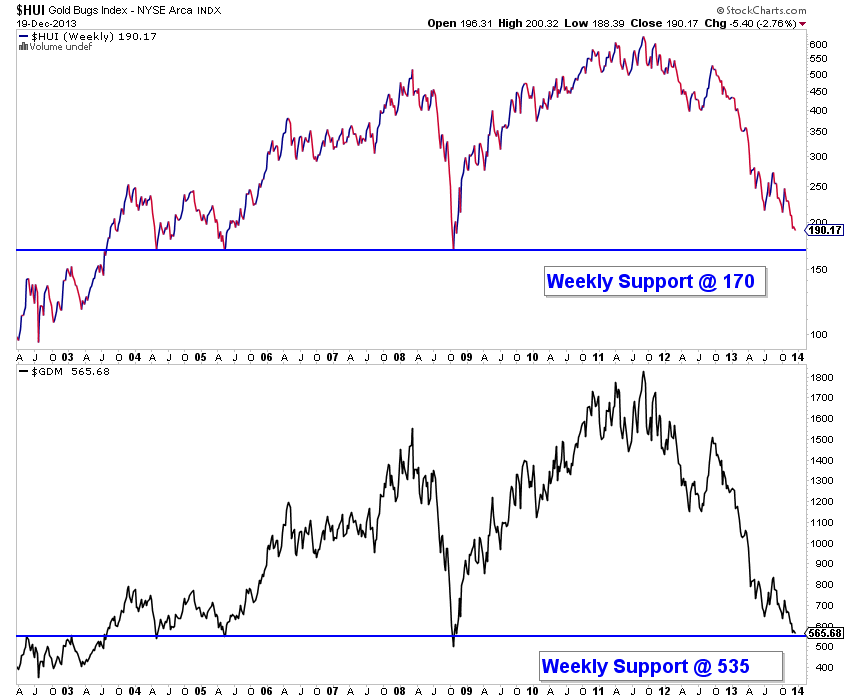
The chart below is a weekly line chart (weekly closes) which shows the HUI Gold Bugs index and the GDM index (forerunner to GDX). The HUI has 10% downside to 9-year support while the GDM, a broader index has 5% downside to support dating back to 2002.
History, as it does for the gold shares, makes a strong argument that the bear in Silver is nearly complete. With a bit more of a decline, the current bear will become the second worst ever. Again, note that the bear markets which lasted longer than the current one were far less oversold at the present point.
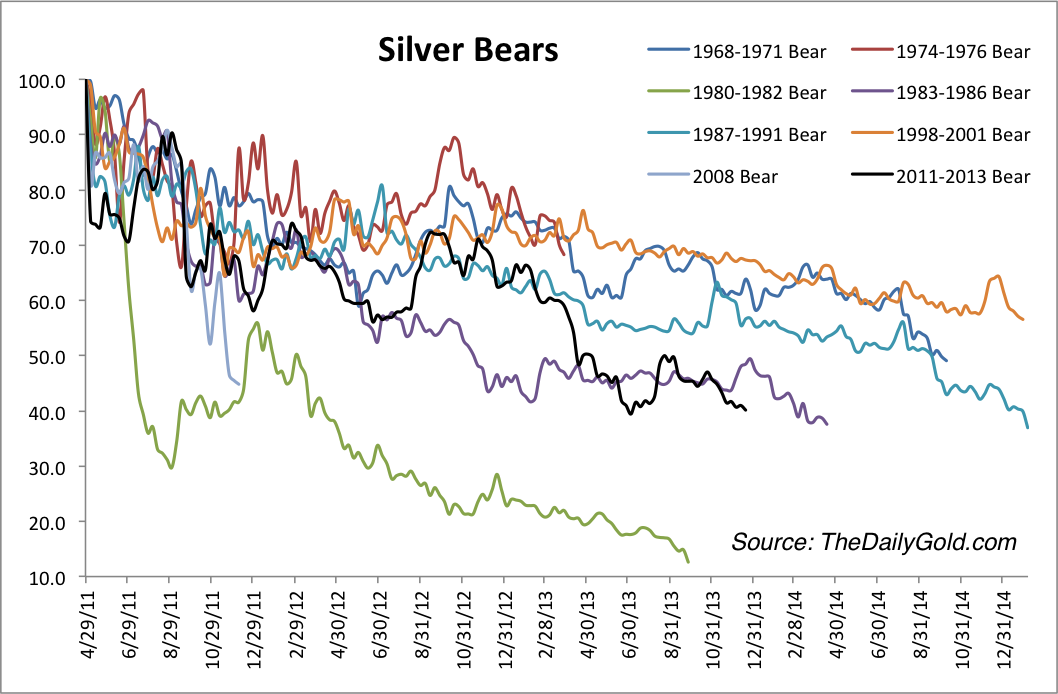
Silver, like Gold has very strong, multi-year trendline support that could mark the bottom after this final selloff.

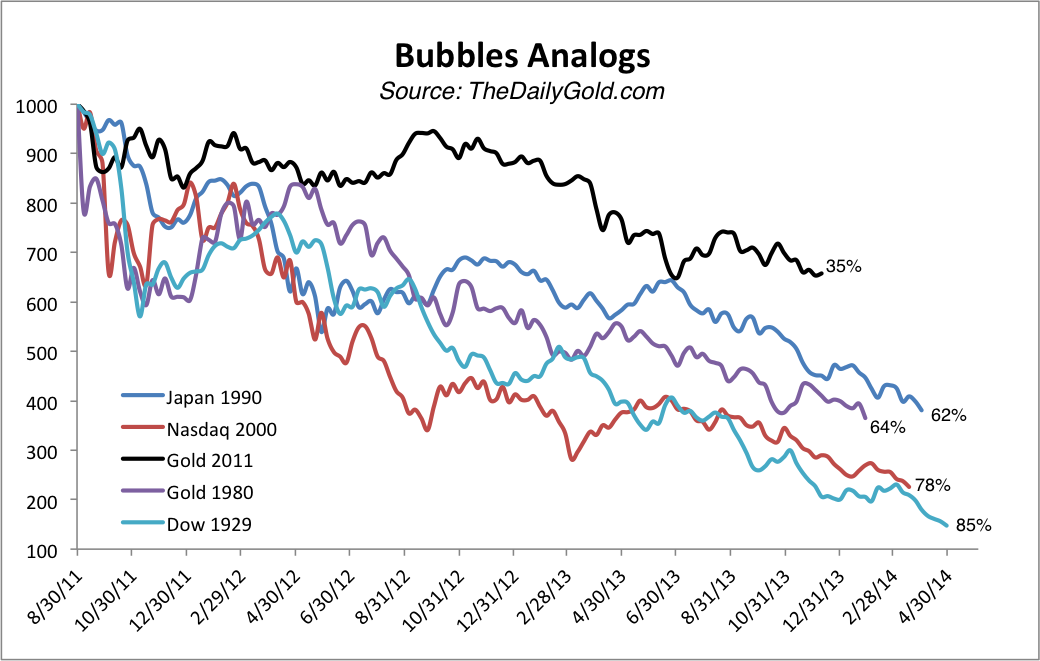
Given the weight of this historical analysis and technical analysis, I don’t see how anyone can argue that the bear market isn’t coming to an end. Bear markets typically last two to three years and are a function of price and time. The more severe the bear is in price, the shorter it lasts. Bears that last more than a few years are less severe in price. These historical charts make a strong argument and the fact that Gold, Silver and the gold stocks are nearing decade long support should increase your confidence substantially. Moreover, the biggest bubbles (Japan, Nasdaq, Gold, 1929) on average deflated by 65% to 85% in two and a half years. The Silver bears chart shows its 87% decline in the early 1980s. If the secular bull market was over, Gold & Silver would already be trading at much lower levels.
Last week we concluded that: “The bottom line is there is no need to aggressively buy yet unless the market becomes extremely oversold and plunges to a new low. Wait for that to happen and if it doesn’t, then a base is likely developing.” Now we know that a final plunge is developing rather than a base. The key to catching a falling knife is to do so at an area of very strong support. I think we’ve laid out the strong support for Gold, Silver and the gold stocks.
No comments:
Post a Comment