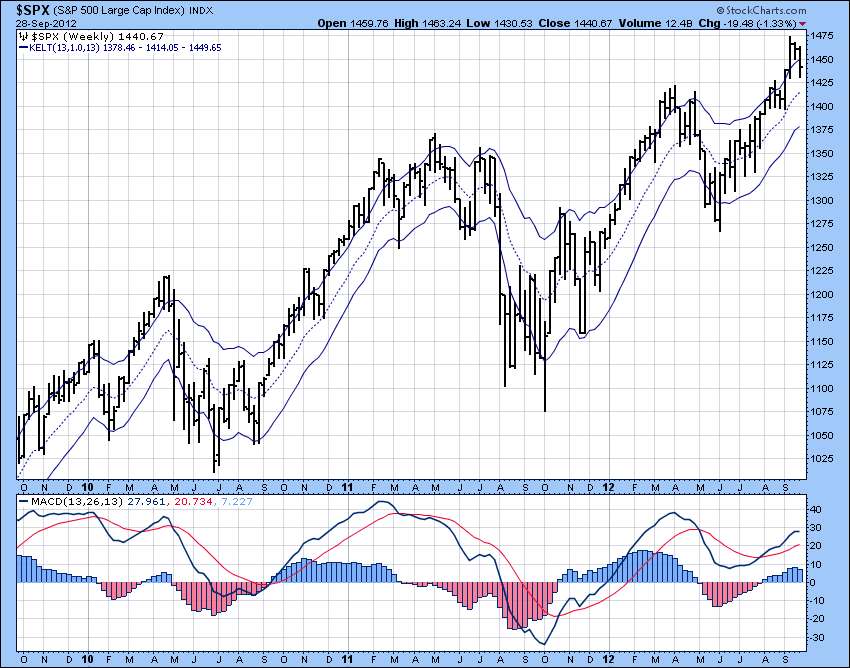
Carl Swenlin noted in a previous post, a growing number of indicators are showing serious bearish divergences, indicating that the bull market we've been enjoying could end abruptly. In my experience, weekly chart MACD divergences are the most powerful of all technical leading indicators, therefore this chart is at the top of my list of red flags. It is only a "potential" MACD divergence at this time because it will not be valid unless MACD ends the week below its trigger line. However, this phenomenon does not occur very often, and it has given some very timely warnings in the past, so it deserves to be watched closely.


No comments:
Post a Comment