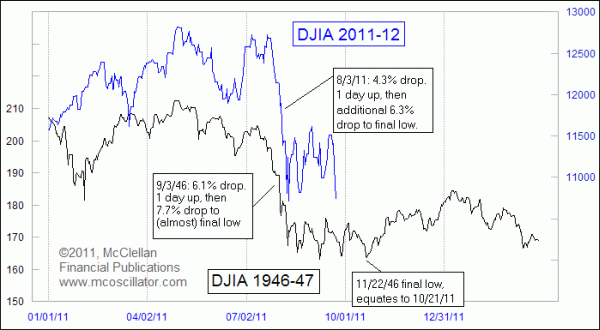
Rather than continuing the decline after the steep plunge, the 1946 market saw a long series of retests, with the DJIA seemingly bouncing along against a price floor for several months. The last of those came on Nov. 22, 1946, and with the price pattern alignment shown in these charts, that equates to a bottom due Oct. 21, 2011.
One point to understand about using price pattern analogs is that eventually the correlation breaks up and stops working. Often that point will arrive at the moment when one is most counting on the correlation to continue working. So one should never give these pattern analogs complete trust, no matter how good they look. But for the moment, the 1946 pattern does seem to be telling us the correct answers about how the current market's corrective period will play out.
No comments:
Post a Comment