Peter L Brandt, June 2nd, 2013.
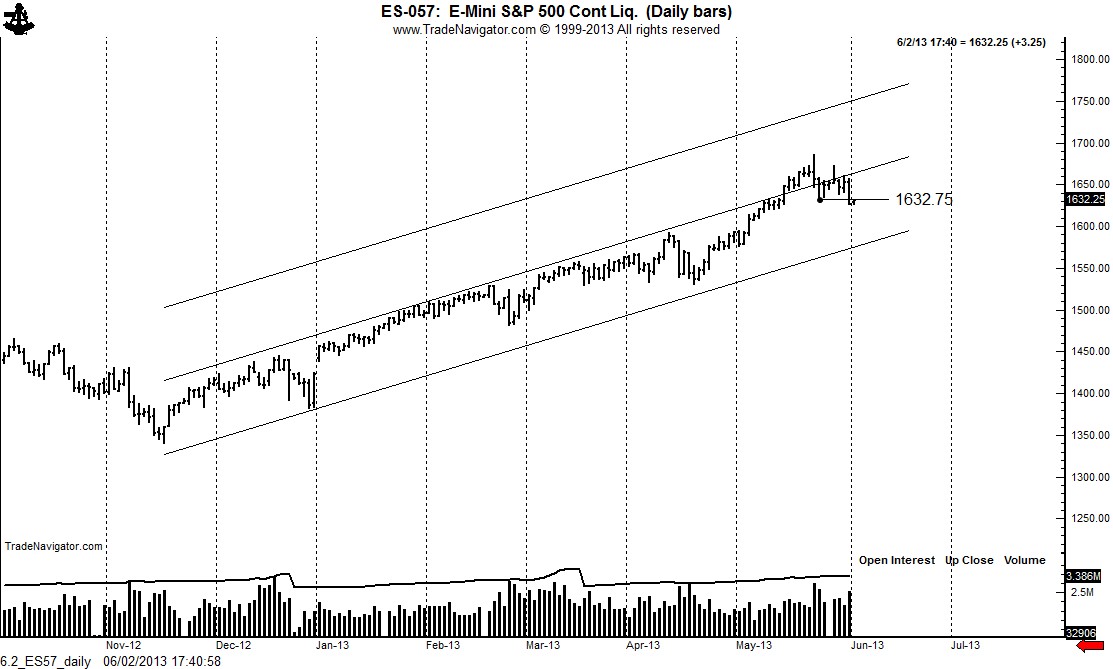
The advance on May 14 in S&Ps penetrated the upper boundary of a 6-month channel. This type of price behavior is typically a sign that the advance will accelerate. However, if the advance does not accelerate, but prices return to the channel, it can be a sign that the upside penetration of the channel was a blow off. Friday’s decline was a warning sign that the May 14 upside breakout was very possibly a blow off.
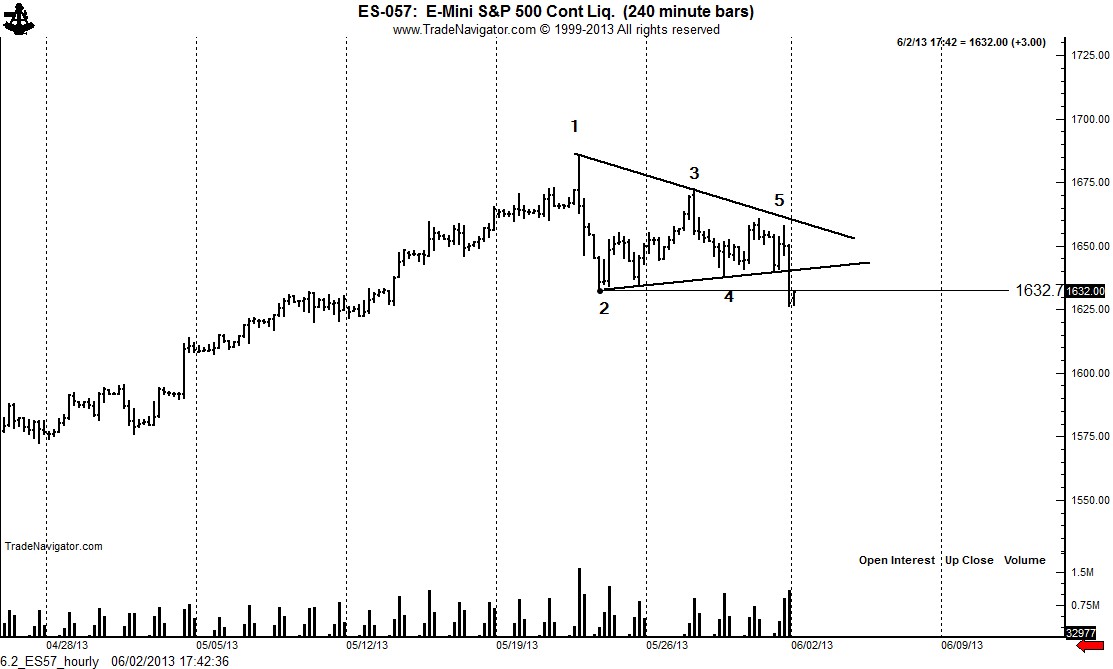
 The intraday graph displays a possible five-point symmetrical triangle top. Further downside momentum this coming week would indicate that the short-term trend has turned down. Funny thing about short-term trends — they sometime become longer-term trends.
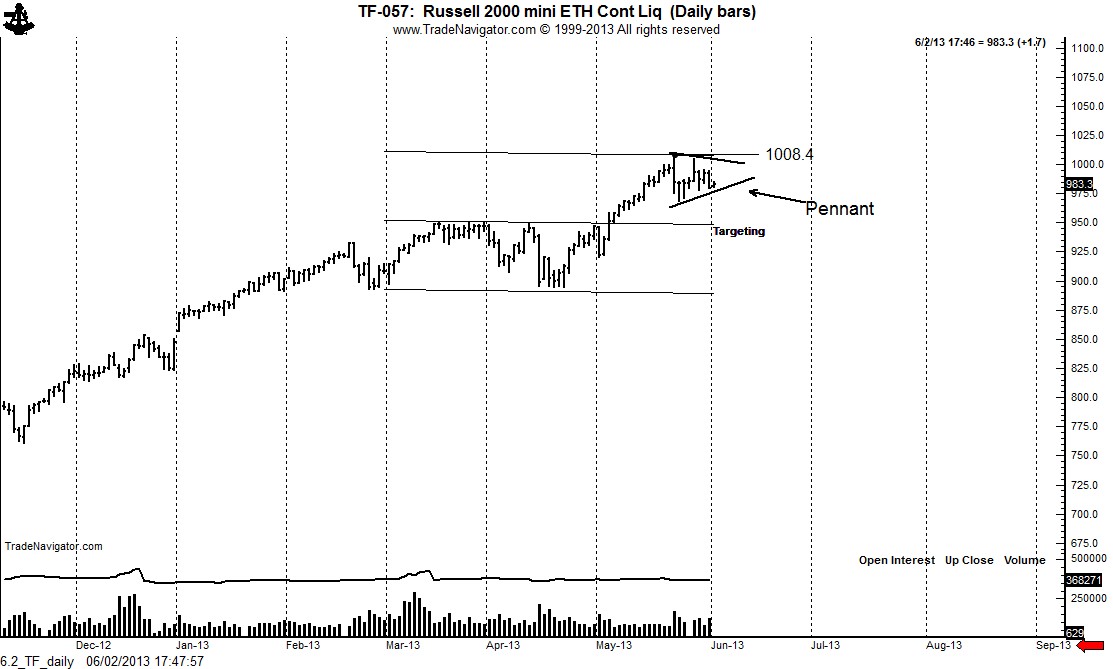
 The Russell 2000 provides a more optimistic chart picture. The daily chart displays a possible pennant. A close above 1009 would complete this pennant and would lead to another strong advance.
 I will take my signals for shorting from the S&Ps and for buying from the Russell.
Near-term price action in the S&Ps and Russell 2000 will determine the next short-term trend
Several chart developments are worthy of note.The advance on May 14 in S&Ps penetrated the upper boundary of a 6-month channel. This type of price behavior is typically a sign that the advance will accelerate. However, if the advance does not accelerate, but prices return to the channel, it can be a sign that the upside penetration of the channel was a blow off. Friday’s decline was a warning sign that the May 14 upside breakout was very possibly a blow off.
No comments:
Post a Comment