All Star Charts
Posted by JC Parets
on June 27th, 2013
This was an interesting one on Thursday. They never make it easy on us do they?
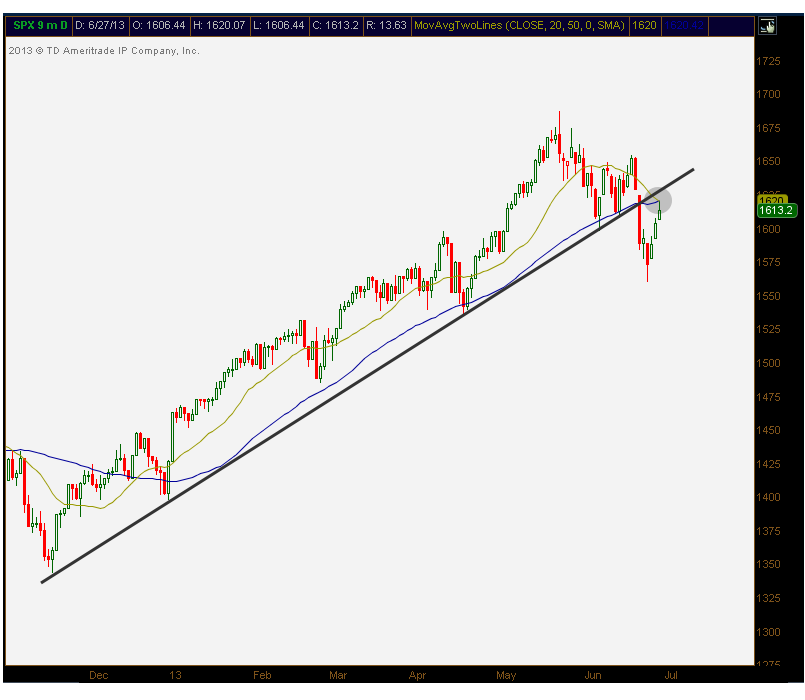
The S&P500 broke a major uptrend line last week – the one that takes us back to November. And we got follow through for a couple of days too. So it wasn’t a brief false breakdown and squeeze like we’ve seen in the past. But since then, we saw three solid up days in the market as we rallied into the 20 and 50 day simple moving averages. Here is what it looks like:
 You can see the declining 20 day for the first time since the uptrend began back in November. At the same time we have it crossing below what is now a pretty flat 50 day. Thursday morning we hit those levels and backed off.
What do you think we do? Broken uptrend, retest of these moving averages? We rolling over hard from here? Or do we rip through, break back above the uptrend line and rally continues?
My bet is on the former. I’m willing to accept the possibility of the latter, but I don’t see it as the probability. At least not today.
Posted by JC Parets
on June 27th, 2013
This was an interesting one on Thursday. They never make it easy on us do they?
The S&P500 broke a major uptrend line last week – the one that takes us back to November. And we got follow through for a couple of days too. So it wasn’t a brief false breakdown and squeeze like we’ve seen in the past. But since then, we saw three solid up days in the market as we rallied into the 20 and 50 day simple moving averages. Here is what it looks like:
What do you think we do? Broken uptrend, retest of these moving averages? We rolling over hard from here? Or do we rip through, break back above the uptrend line and rally continues?
My bet is on the former. I’m willing to accept the possibility of the latter, but I don’t see it as the probability. At least not today.
No comments:
Post a Comment