All Star Charts
Posted by JC Parets
on June 24th, 2013
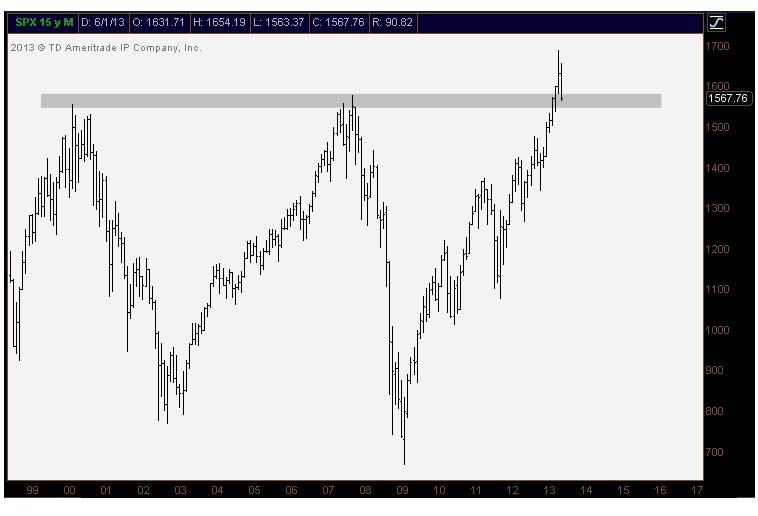
I don’t hear a lot of people talking about this one. I’ll bring it up one last time because I think it’s worth consideration. What happens if this recent move in the S&P500 above the 2007 highs was a false breakout? What then?
On the way up, we were all hearing about this 2007 resistance. How we had to acknowledge it and at least correct when we arrived there. But then we got through and held above it for a couple of months, and everyone forgets. So does this mean the old resistance no longer exists and it should be ignored?
 From false moves, come really fast ones in the opposite direction. There’s no doubt about it. And this can be applied on all time frames, from 10-minutes to monthly charts. Last week in the US Dollar index we saw a nice false breakdown in the 10-min chart and the ensuing rip-your-face-off rally. In this case, we’re looking at a long-term chart of the S&P500.
Is anyone worried that this was a false breakout? Or should we just ignore it because it was so long ago?
Posted by JC Parets
on June 24th, 2013
I don’t hear a lot of people talking about this one. I’ll bring it up one last time because I think it’s worth consideration. What happens if this recent move in the S&P500 above the 2007 highs was a false breakout? What then?
On the way up, we were all hearing about this 2007 resistance. How we had to acknowledge it and at least correct when we arrived there. But then we got through and held above it for a couple of months, and everyone forgets. So does this mean the old resistance no longer exists and it should be ignored?
Is anyone worried that this was a false breakout? Or should we just ignore it because it was so long ago?
No comments:
Post a Comment